Search

Admin Activities-FAQs

Articles

You can perform Jiffy Application restart for the following incidents/situations:
  1. Task executions are stuck from design screen and Execution screen. Messages are pilled up in rabbit MQ.
    • This can happen when resource (Memory/CPU utilization /Disk IO) is high OR Rabitt MQ consumer threads are stuck.
  2. Connection loss between jiffy core and DB(mongo)
  3. redis is down
  4. Jiffy application is down because of a planned /unplanned linux server reboot.
  5. Drill connection errors: Restart the following processes in the given sequence.
    1. Zookeeper
    2. Drill
    3. Zues

  1. Check if Random no task is execution is working or not. If random no task is executing fine, check for any issue on windows machine/Bot machine.
  2. Check for CPU and memory utilization of different processes and load average on core server- using top command.
  3. Check for Disk space on server-using df –Th command. (If it is 100%, then try release some space. In this case application restart is not required )
  4. Check for free memory/ram utilization on server- using free command.
  5. Check Rabbitmq if any of the queues are stuck/unacknowledged and is getting consumed or not.

  1. Stop all the Polling and terminate pending task from DB before going for application stop and Terminate the Bot gracefully. {Let the current execution complete.]
  2. Check for Disk space. If there is a disk space issue, stop application to clear/increase disk space.
  3. Once application is stopped, Check rabbitmq and purge unacknowledged queues if no consumers available.
  4. Check for memory/RAM usage, disk usage, and memory utilization before going for Jiffy application restart.
  5. Go for Jiffy application restart if all looks fine.

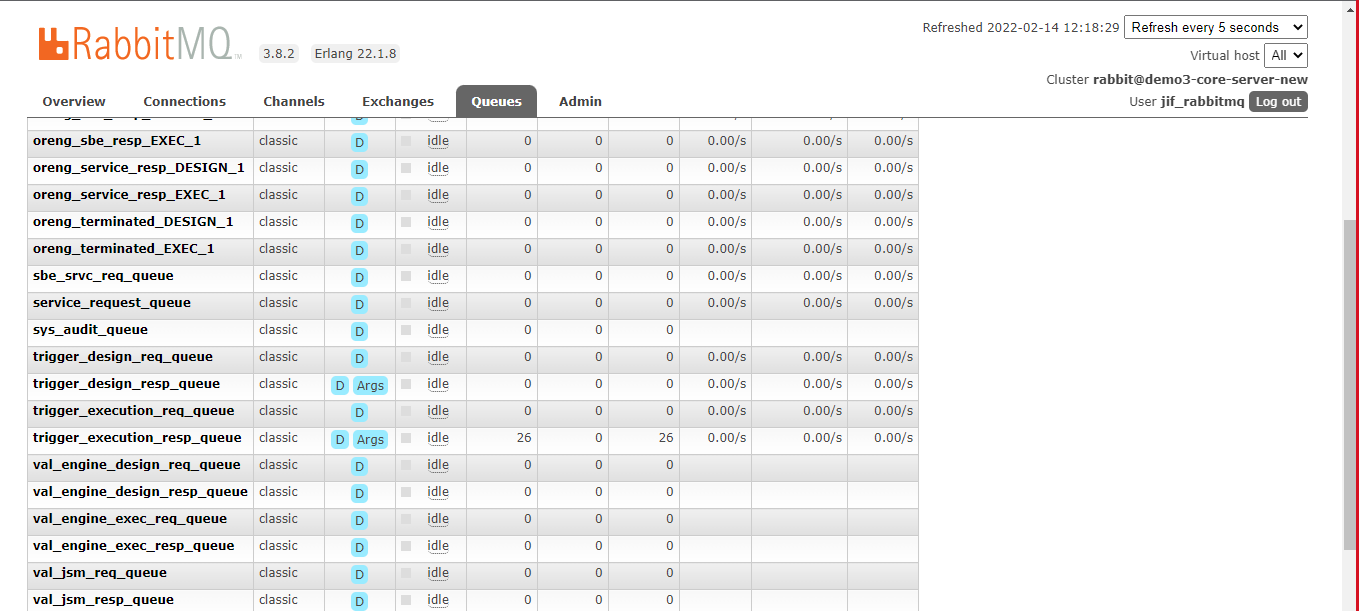
  1. If there is any issue with Rabbitmq like rabbitmq crash/rabbitmq logs are consuming disk space then rabbitmq stop/start process to be followed after jiffy application stop for rabbitmq setup/clearing logs
  2. If there is an issue where nginx logs are consuming disk space then nginx stop/start process need to be followed to clear logs after jiffy application stop

  1. Login to server using Putty/Mobaxterm.
  2. Enter the Username and Password to login to the application.

    Contact Admin for the URL and login credentials.

  3. To stop the Jiffy application, type the following command.

    $supervisorctl stop all

  4. To stop particular process, type the command as below.

    $supervisorctl stop "process name"

  5. Before starting the application, it is required to grep the export key once. Type the following command.

    $history |grep export

  6. Copy the export key, and type the following command.

    $export="paste the export key"

  7. To start the application processes, type the following command.

    $supervisorctl start all

  8. After starting the application, make sure all the processes are running fine using the below command.

    $supervisorctl status

  1. To launch the Grafana, type the Jiffy URL on the browser then type the path as "/Grafana" and press Enter key .

    https://trainees.saas-1.jiffy.ai/grafana

    Grafana provides charts, graphs, and alerts for the web when connected to supported data sources. In the Grafana, user can view the all logs for Jiffy, anthil,coral,filesercer,gus etc. as per Jiffy application.
  2. To see the logs, click on the Explorer icon, select the process name which you wanted to see the logs.

    For example Loki, then select the log label dropdown as Loki and press Enter. Now it displays all the logs.

    Image description
  3. To get the logs only from few hours/minutes/days, then click on the Duration drop-down and select the time duration as per the request and click on the Run Query button. Image description
  4. To see only the error logs, then type the following command in the Log label search field.

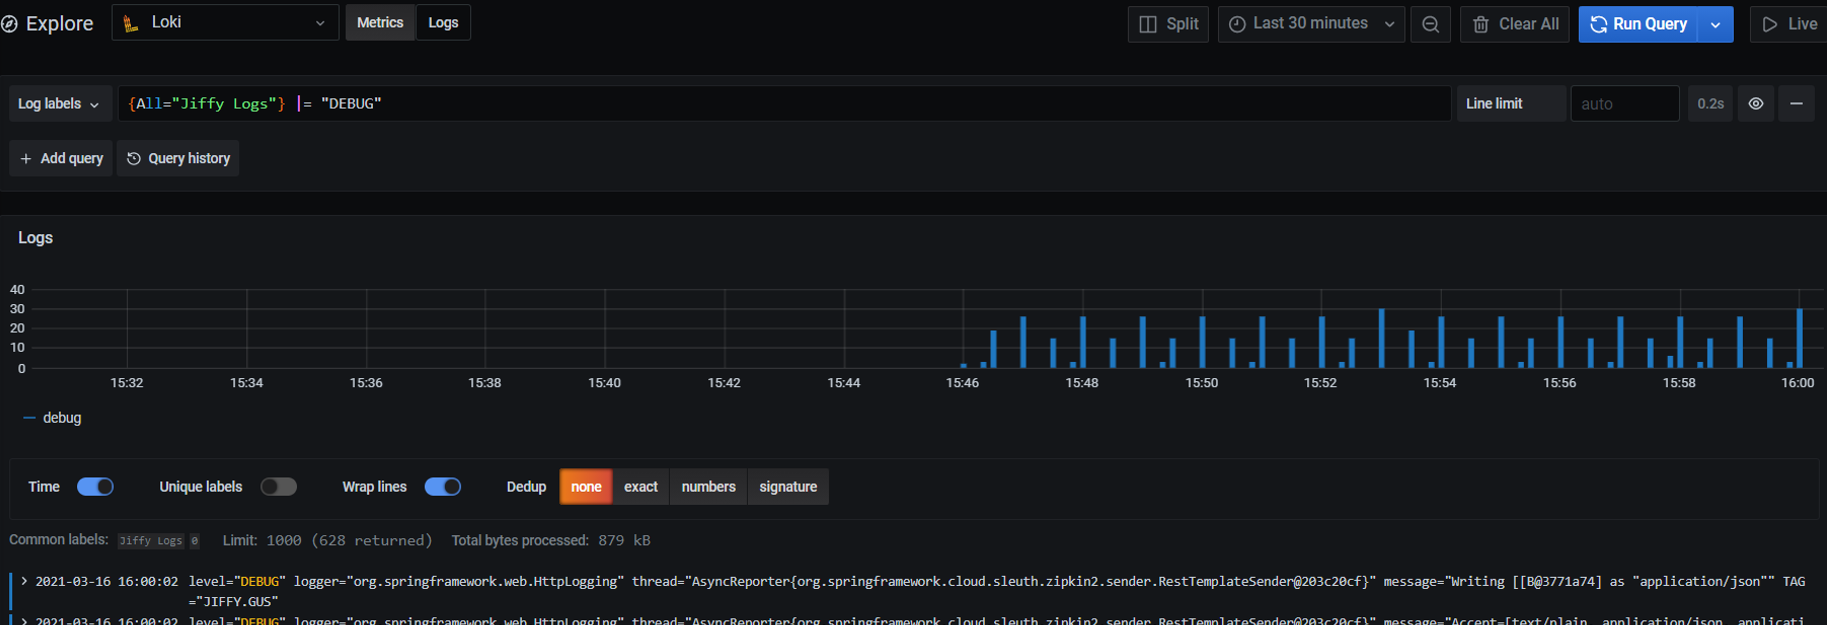
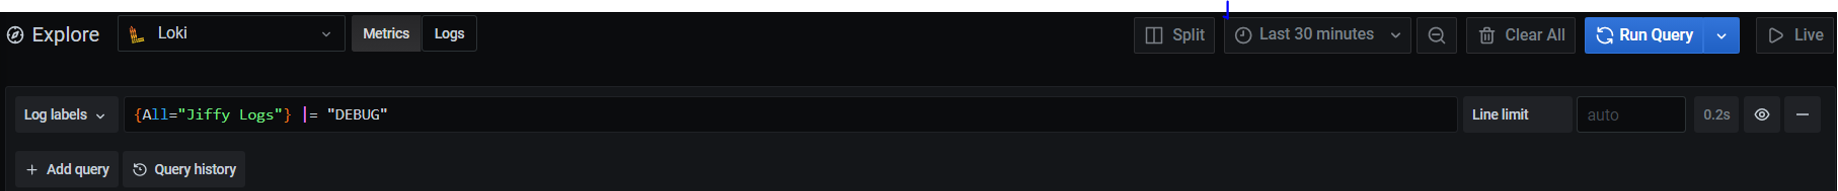
    {All="process name you wanted to see the logs"} |="ERROR"

  5. Click on the Run Query button to dispaly the Error logs for the selected process.

The Grafana is not available from Jiffy 4.6 release. In this case, the Kibana was introduced to see all the error logs for all the processes.

  1. Check with random number task execution from the design screen.
  2. If the random number task is working fine from the design screen please investigate jiffy Jpipe client logs(path: C:/jiffy service)
  3. If the random number task is not working from the design screen please connect to the rabbitmq🡪Queues
  4. Check consumers are available in trigger_design_request queue, trigger_design_response_queue.
  5. If Consumers are not available then please check in Linux server for, the reason for causing this issue .
If consumers are not available in trigger_design_request_queue or trigger_design_response_queue, Stop the design processes and purge the queues then start the processes

  1. Check with random number task execution from the execution screen. 
  2. If the random number task is working fine from the execution screen, share jiffy Jpipe client to jiffy support(path: C:/jiffy service). 
  3. If the random number task  is not working from the execution screen, connect to the rabbitmq Queues Check consumers are available in trigger_execution_request queue, trigger_execution_response_queue. 
  4. If Consumers are not available, check in the Linux server for, the reason for causing this issue.   
  5. If consumers are not available in trigger_execution_request_queue or trigger_execution_response_queue. Stop the execution processes and purge the queues then start the execution processes. 
  6. If consumers are not available in trigger_design_request_queue or trigger_design_response_queue.
  7. Stop the design processes and purge the queues then start the processes.  
Image description

If Testcase is stuck and in logs we are getting Clearing Key from Redis: Trying to acquire the lock: Regression_Basic" TAG="JIFFY.CORAL"
Clear key from REDIS:
jiffyEnv) [jiffyapp-usr@jarvis-qa6 ~]$ cd /opt/docube/redis-6.0.5
You have new mail in /var/spool/mail/jiffyapp-usr
(jiffyEnv) [jiffyapp-usr@jarvis-qa6 redis-6.0.5]$ ./src/redis-cli --tls --cacert
./tests/tls/ca.crt
127.0.0.1:6379> AUTH 12345
(error) WRONGPASS invalid username-password pair
127.0.0.1:6379> Auth 123456
(error) WRONGPASS invalid username-password pair
127.0.0.1:6379> AUTH 123456789
OK
127.0.0.1:6379> KEYS *
To get redis password:
cat /opt/jiffy/auth/app_details
source /opt/jiffy/.envs/jiffyEnv/bin/activate
Export PASSPHRASE={pass_phrase} //will get from /opt/jiffy/auth/password_key
cd /opt/jiffy/deploy/jiffy/src/
python ../conf/get_pass.py startup redis_password
Copy this value and
echo {value from prev step} | base64 -d will give the password
127.0.0.1:6379> KEYS Regression_Basic
(empty array)
127.0.0.1:6379> KEYS *Regression*
1) "lock::Regression_Basic"
127.0.0.1:6379> del Regression_Basic
(integer) 0
127.0.0.1:6379> del Regression_Basic
(integer) 0
127.0.0.1:6379> del lock::Regression_Basic
(integer) 1
127.0.0.1:6379> KEYS *Regression*
(empty array)
127.0.0.1:6379> KEYS *lock*
1) "lock::Invoice DocTable"
127.0.0.1:6379> del lock::”Invoice DocTable”
(integer) 1
127.0.0.1:6379>
GUS is not starting:
"l.lockservice.StandardLockService : Waiting for changelog lock...."
gus=# select * from databasechangeloglock; id | locked | lockgranted | lockedby ----+--------+-------------------------+------------------------- 1 | t | 2021-04-30 12:43:18.251 |
172.17.0.1 (172.17.0.1) ​
update databasechangeloglock set locked=false where id=1;
lock may set to true sometimes when you kill the server in the middle of starting the server. Grafana password: QA4-1 : https://tenant.jiffy4-1qa.jiffy.ai/grafana/ admin/jarvisqa@321# Size issue: Check df -h after login

Clear Old Certificate Bindings
You must remove the old certificate binding from the jiffy ports.
  • To show all the ports and certificate details:

    netsh http show sslcert > filepath

  • Get the list of Hostname:port from above file by filtering with the current certhash

    C:\Windows\system32> netsh http show sslcer

    Image description
  • For each Hostname:port remove the binding with the following command.

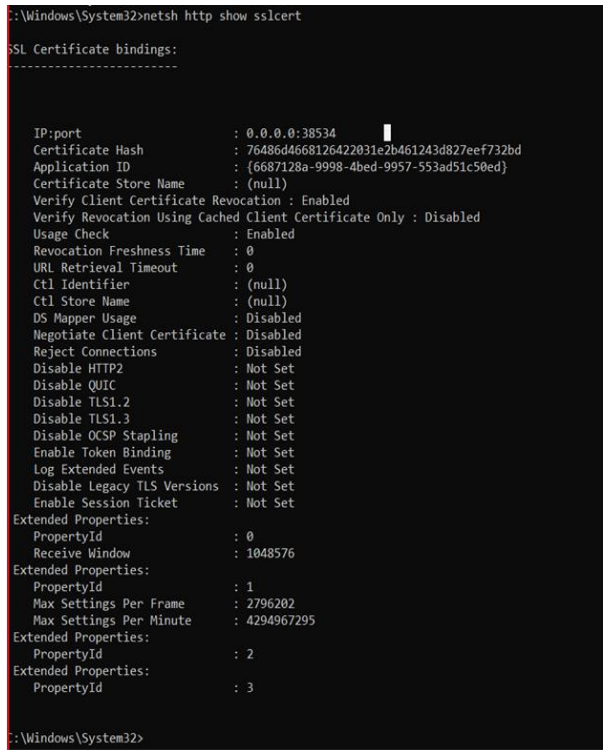
    netsh http delete sslcert ipport=0.0.0.0:385xx

Add New Certificates
  • CertUtil -f -importPFX My C:\Users\PIPL-IT-169\Downloads\certificatebot.pfx

  • CertUtil -f -addstore My C:\Users\PIPL-IT-169\Downloads\certificatebot.crt

  • Now add the Thumbprint value of the new certificate to config.yml file present in the below path

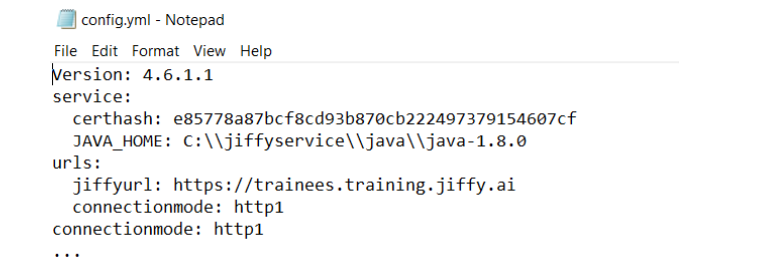
    C:\jiffyservice\config.yml

    Image description
  • Paste the thumbprint value in place of certhash value Image description
  • For each Hostname:port remove the binding with below command. netsh http delete sslcert ipport=0.0.0.0:38534
Update Jiffy Service
  1. List all the alias associated with the new certificate using the following command.

    1. cd C:\jiffyservice
    2. "C:\jiffyservice\java\java-1.8.0\bin\keytool.exe" -v -list -storetype pkcs12 -keystore
    3. C:\Users\PIPL-IT-169\Documents\certificatebot.pfx

    Image description
  2. Run the below command with the alias name to update the jiffy service.

    "C:\jiffyservice\java\java-1.8.0\bin\keytool.exe" -importkeystore -srckeystore C:\Users\PIPL-IT-169\Documents\certificatebot.pfx -srcstoretype pkcs12 -srcalias dcd14fce-bdc3-4175-9e46-24c08f5664cf - destkeystore ssl-server.jks -deststoretype jks -deststorepass changeit -destkeypass changeit -destalias ssl

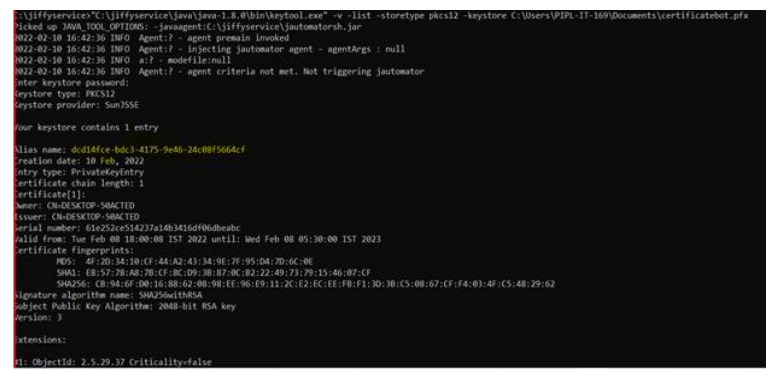
    The above command will create ssl-server.jks file which should be placed in C:\jiffyservice folder .
  3. To verify the updated certificate in java keystore use the below command.

    C:\jiffyservice\java\java-1.8.0\bin\keytool.exe -list -v -keystore c:/jiffyservice/ssl-server.jk

Did you find what you were looking for?