The Desktop UI node is used to automate the user interface of any desktop application.
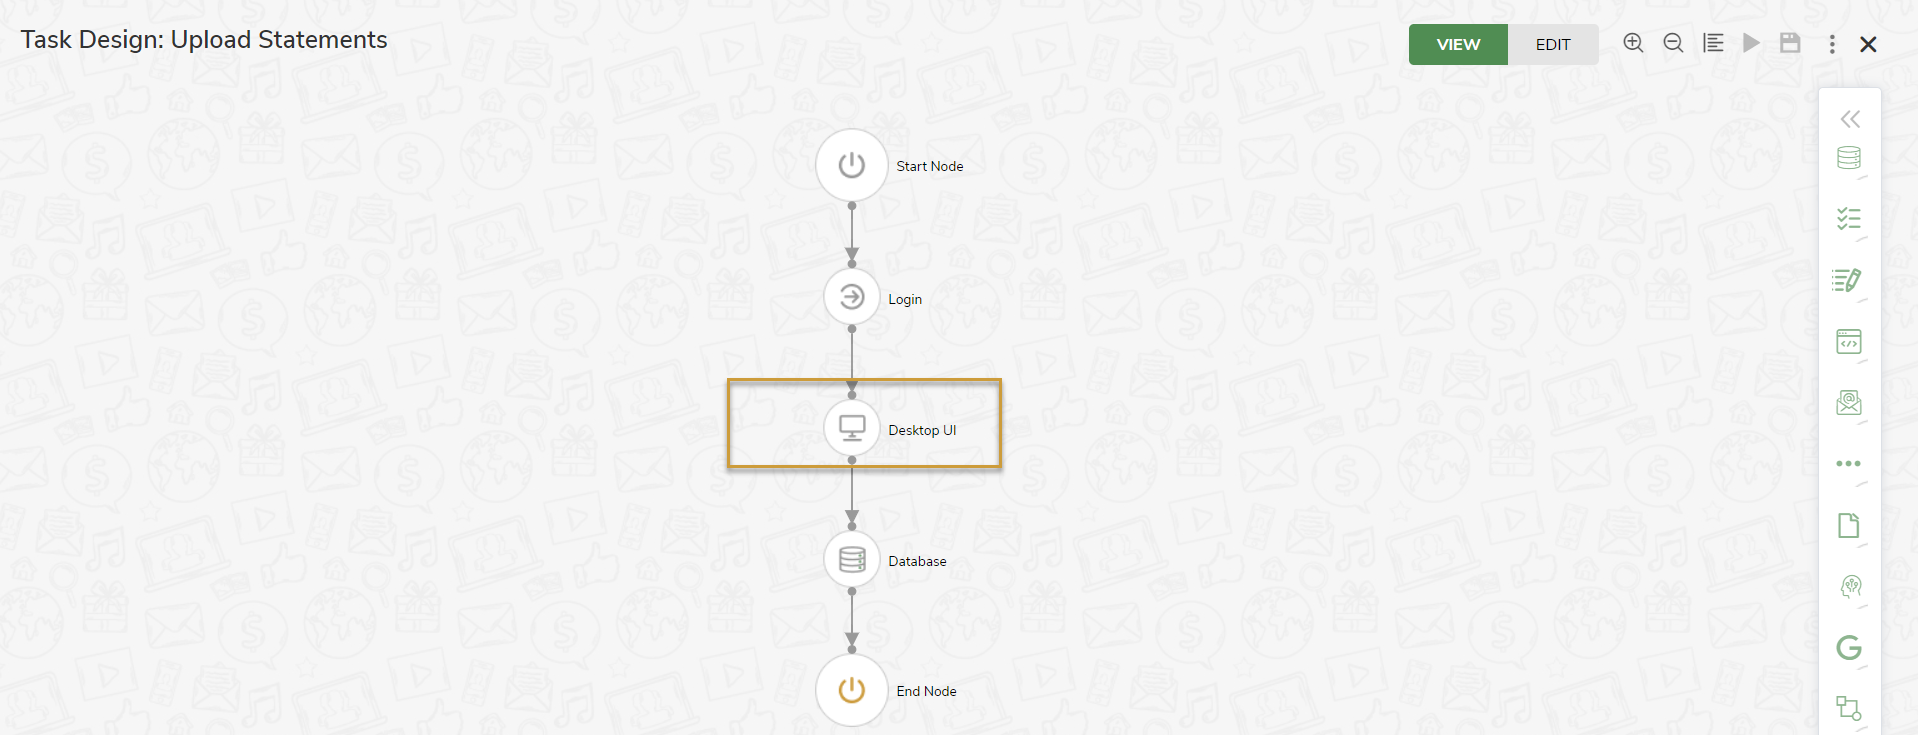
In Upload Statements HyperApp, the user actions for uploading the files in an Advisor Desktop Application are automated using Desktop UI node.
Configurations of Desktop UI Node
- Click the Desktop UI node to open the attributes pane.
- In Configurations tab, enter the following details:
- App: All the desktop applications that are opened previously get listed in the drop-down. Select the application to be automated.
- App Name: An intuitive name for the application so that it can be reused across similar process automation.
- Cluster: Select Cluster from the drop-down if you wish to run the node on Cluster. Otherwise, leave it blank.
Properties of Desktop UI Node
- Navigate to Properties tab, enter Name and Description.
- Select options for Run Mode and Take screenshot fields from the drop-down.
- Enable Close Application, Close Application on Error, Mark run Failure on Node Fail, Continue on Failure, and Lock After Run options as required.
Record UI of Desktop Application
You can record the actions to be performed in desktop application using JiffyUILearn App. To know more about how to record the actions, click here.
In the Notepad application, hover and press Ctrl key on File, Open, File name, Open, and Save options to record them.
Actions in Desktop UI Node
All the recorded UI Controls and actions are auto-listed in Actions tab, where you can modify actions as per automation flow.
Variables
All Input/Local variables created for the node are displayed under Variables tab.
Table Definitions
All Default and Custom DataTables created in the Task are displayed under Table Definitions tab.
Result of Execution in Desktop UI Node
After executing task, Result of Execution window is displayed with the following tabs.
- Input: The input variables that are mapped to the Desktop UI node are displayed.
- Output: Execution status and the values of the output variables in the current node that can be mapped to the succeeding nodes are displayed.
- Run Info: The Run Details, Configuration Details, and Machine Details are displayed.
- Run Details include Run ID, Sequence Number, Iteration ID, and Total Node Execution Time (in seconds).
- Configuration Details include Configuration Name, App, Application Path, Clusters, and Config Level.
- Machine Details include ID, Name, Host, Port, Iteration Start Time, Iteration End Time, and Iteration Time (in seconds).
- Step Data: The details and status of the each Line of Action inside the node are displayed.
- Formatted Output: The table data of the output variable with Type selected as Table is displayed.

.png)
.png)
.png)
.png)
.png)