
Configure Alerts
Last Updated: Jul 21, 2021
Last Updated: Jul 21, 2021
You can configure alerts in Kibana to notify in case of Task timeout or long-running Tasks, Task hung, task failures, etc. When data from one or more Elasticsearch indices meets the conditions specified, alerts are triggered.
Jiffy Task failures are notified by email to the support team(support@jiffy.ai).
 icon and select the Alerting option.
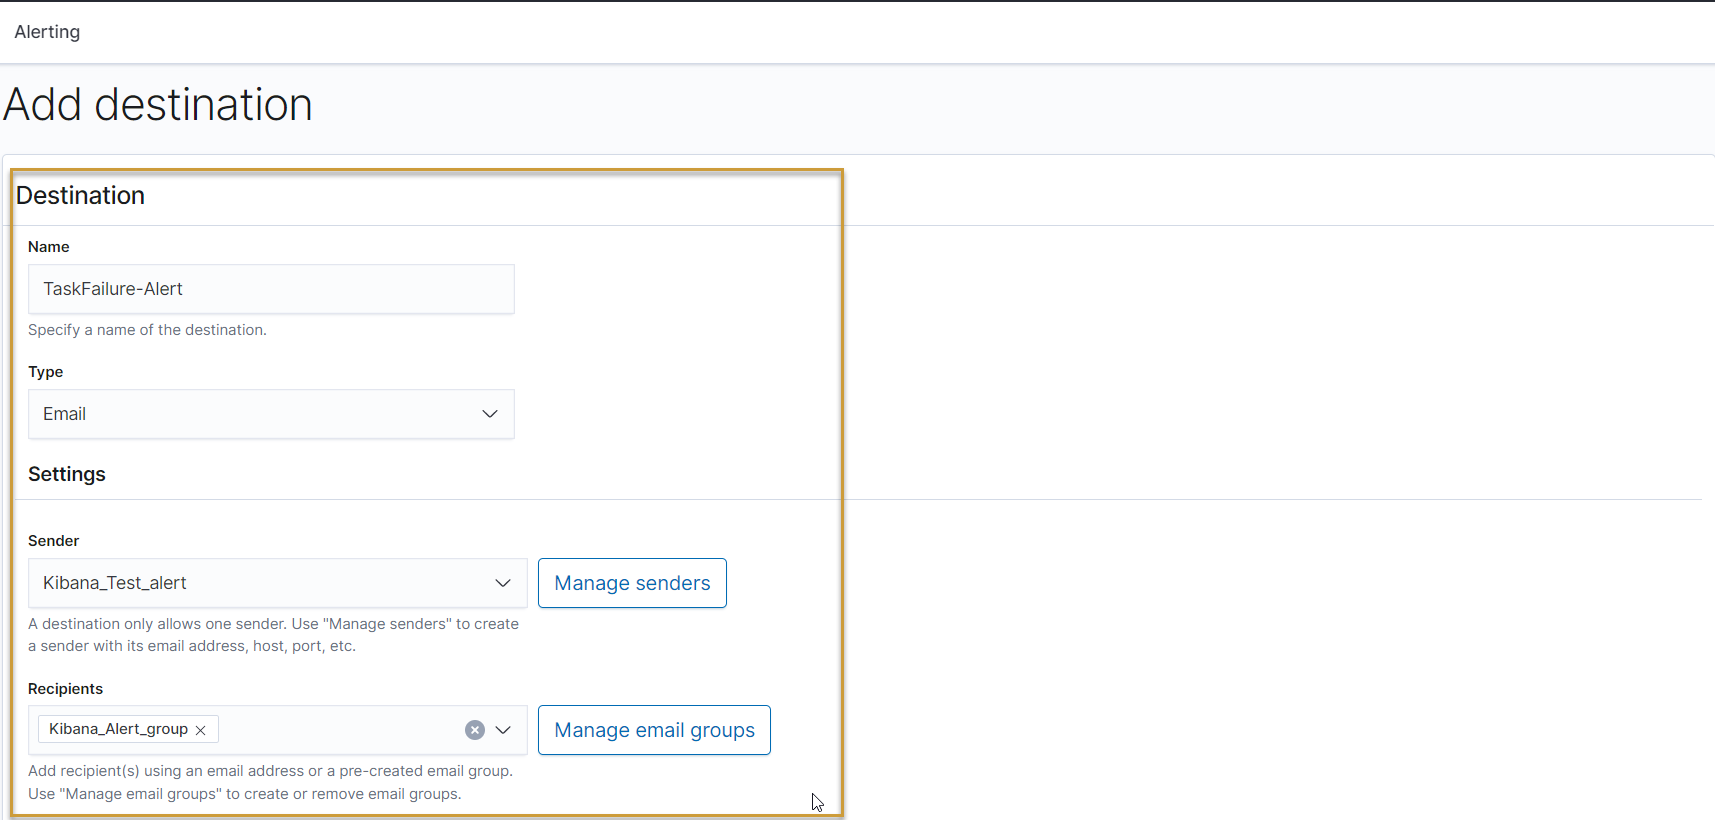
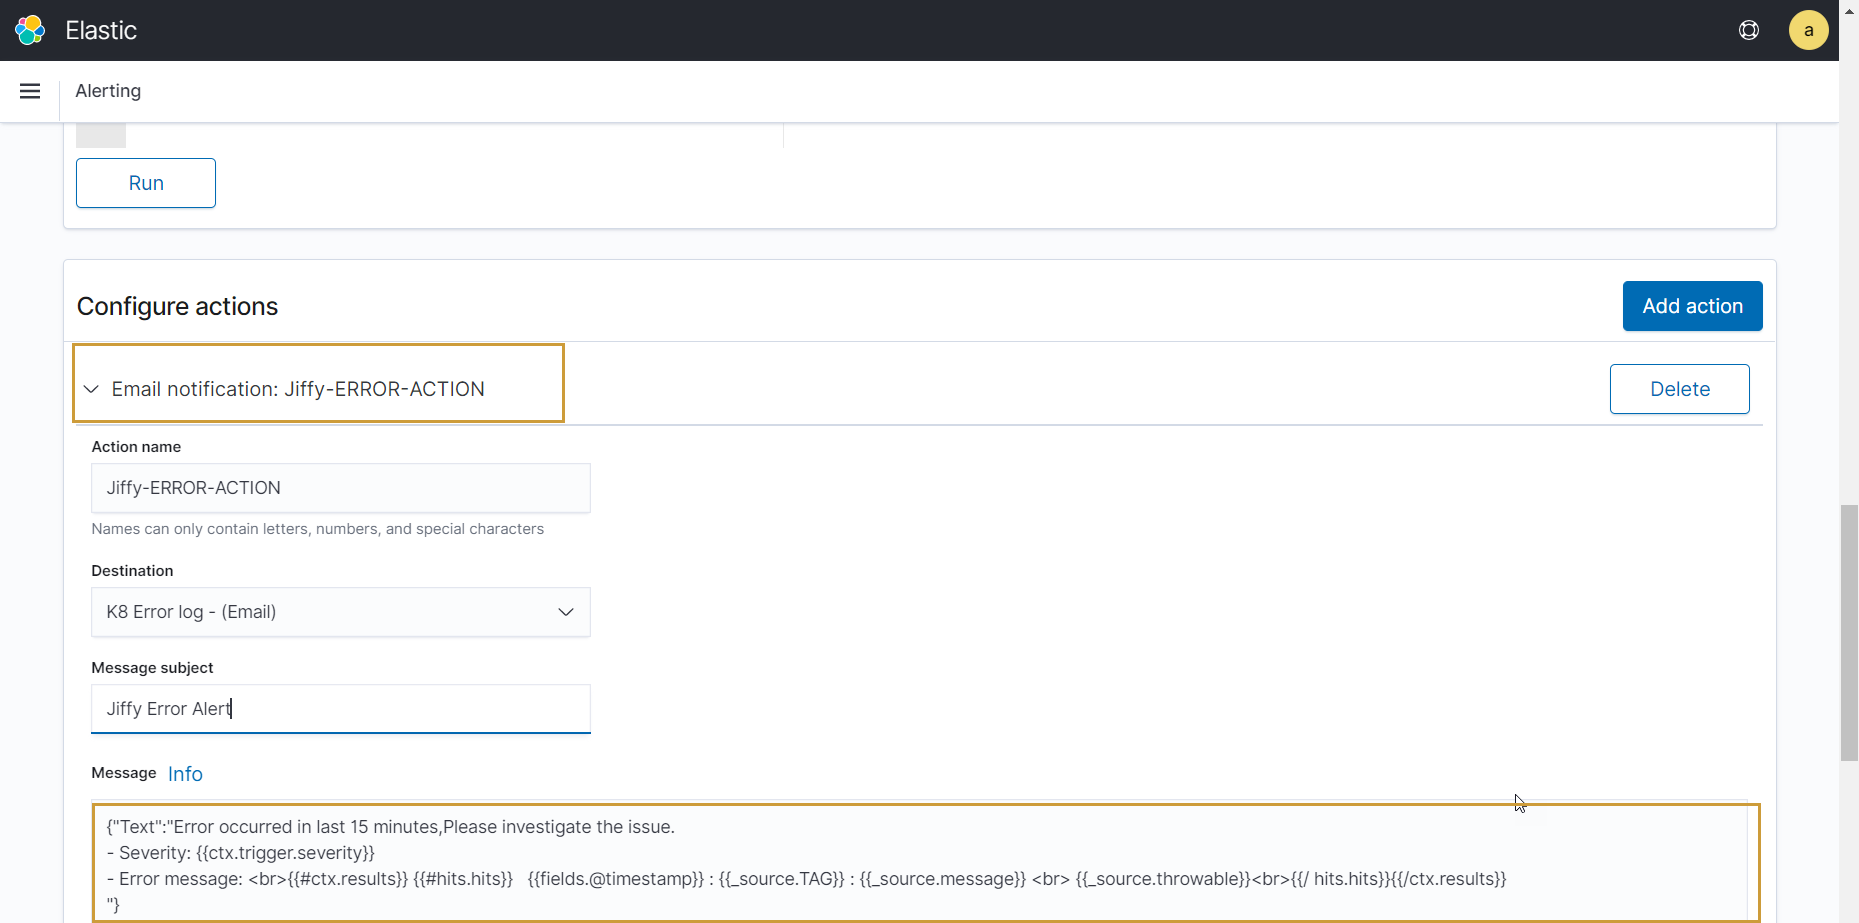
You can set the details of the recipients in the Destination field, so that the relevant alert is sent to them.
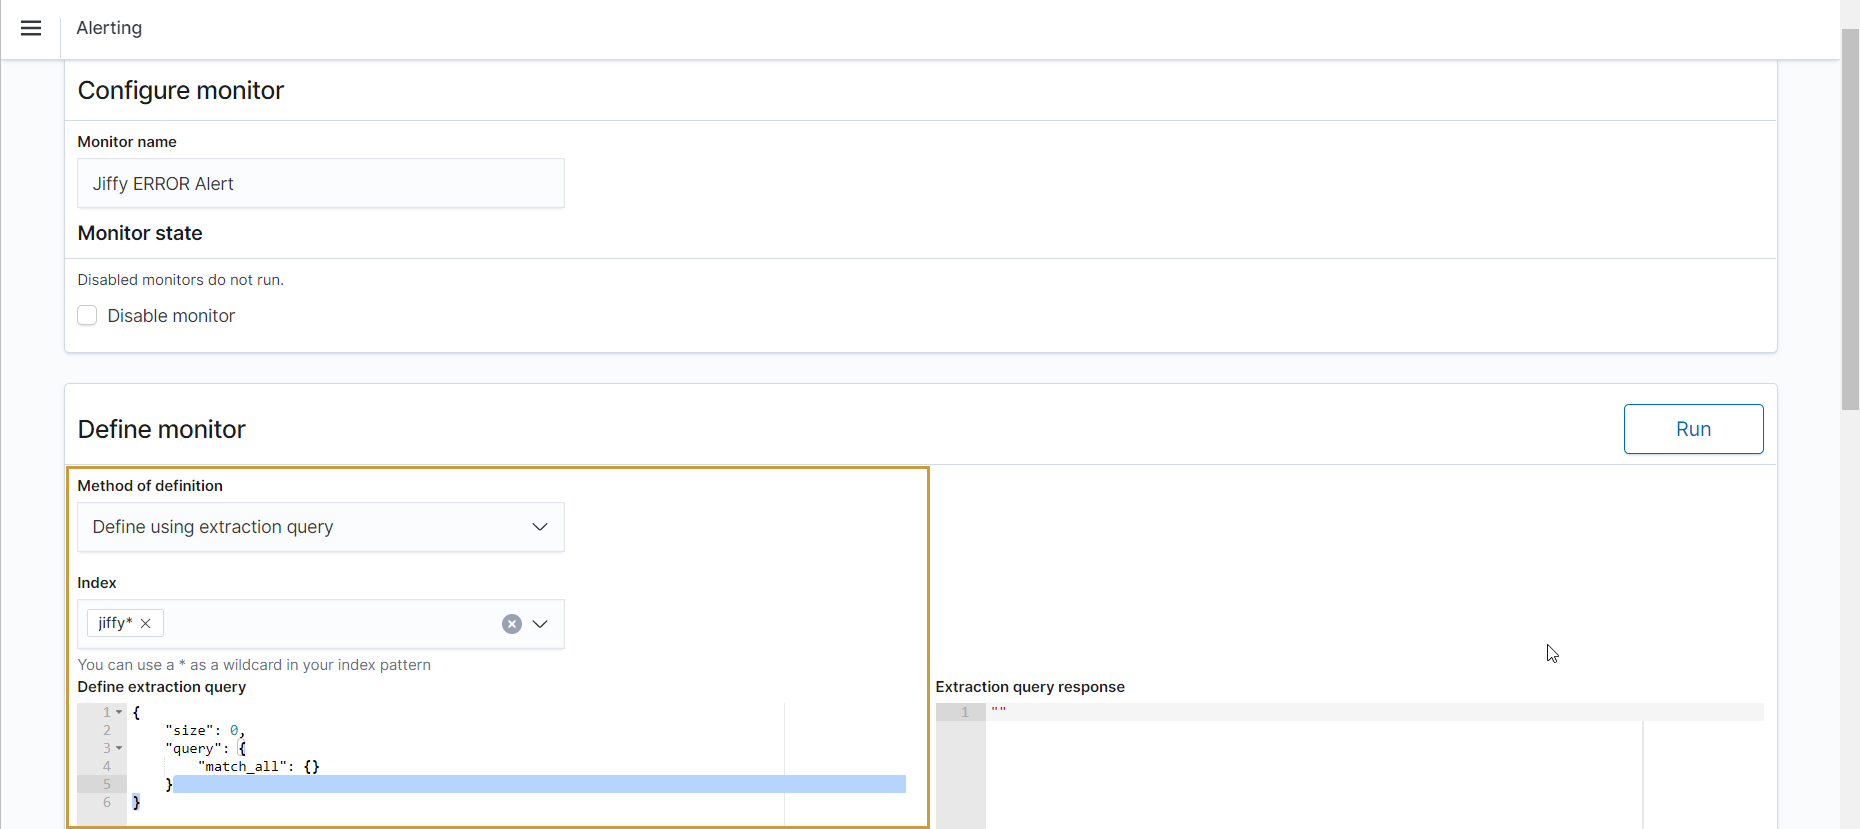
The following query is for Task Execution Failed/Execution Time exceeded.
{ "version": true, "size": 500, "sort": [ { "@timestamp": { "order": "desc", "unmapped_type": "boolean" } ], "aggs": { "2": { "date_histogram": { "field": "@timestamp", "fixed_interval": "3h", "time_zone": "Asia/Calcutta", "min_doc_count": 1 } } }, "stored_fields": [ "*" ], "script_fields": {}, "docvalue_fields": [ { "field": "@timestamp", "format": "date_time" } ], "_source": { "excludes": [] }, "query": { "bool": { "must": [], "filter": [ { "match_all": {} }, { "bool": { "should": [ { "match_phrase": { "message": "Task Execution Failed" } }, { "match_phrase": { "message": "Execution time exceeded" } } ], "minimum_should_match": 1 } }, { "bool": { "should": [ { "match_phrase": { "level": "WARN" } }, { "match_phrase": { "level": "ERROR" } } ], "minimum_should_match": 1 } },{ "range": { "@timestamp": { "from": "now-30h", "to": "now", "include_lower": true, "include_upper": false, "boost": 1 } } } ], "should": [], "must_not": [] } } }
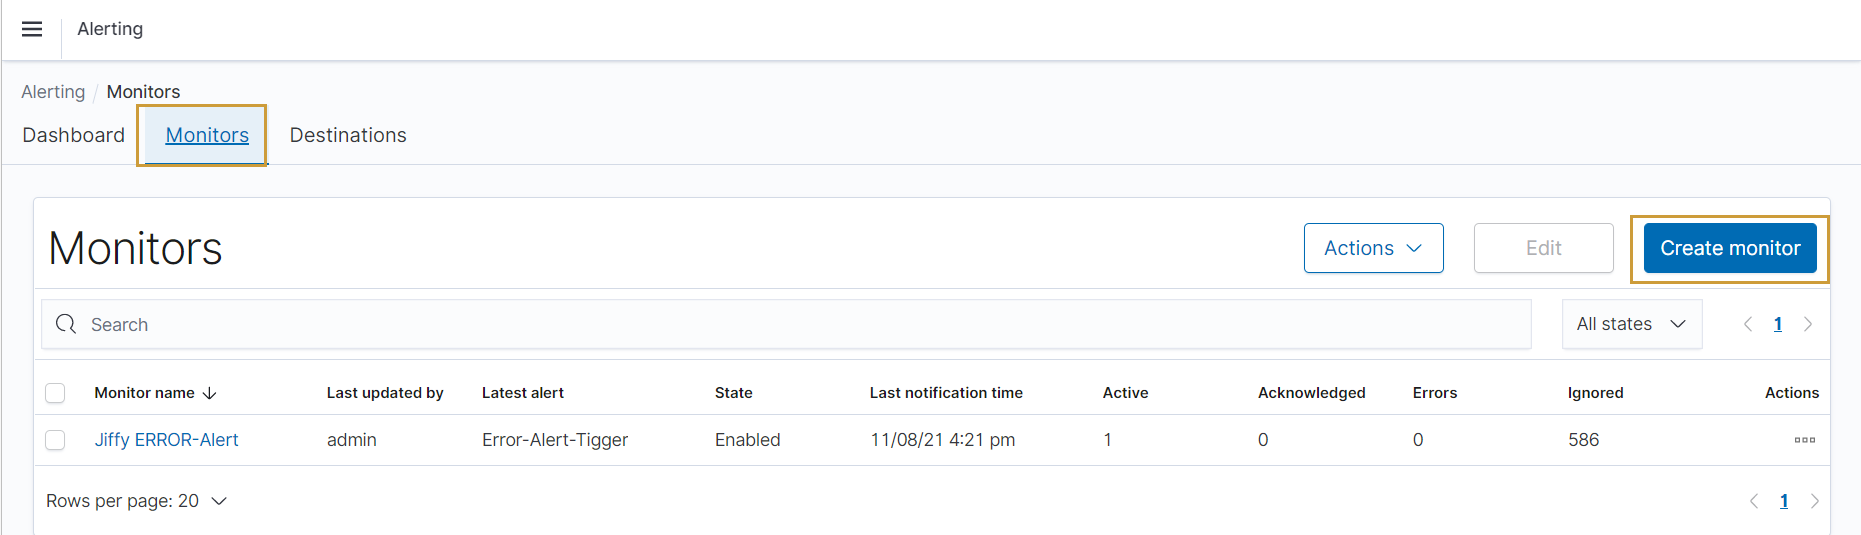
All the monitors created are listed under the Trigger Section.
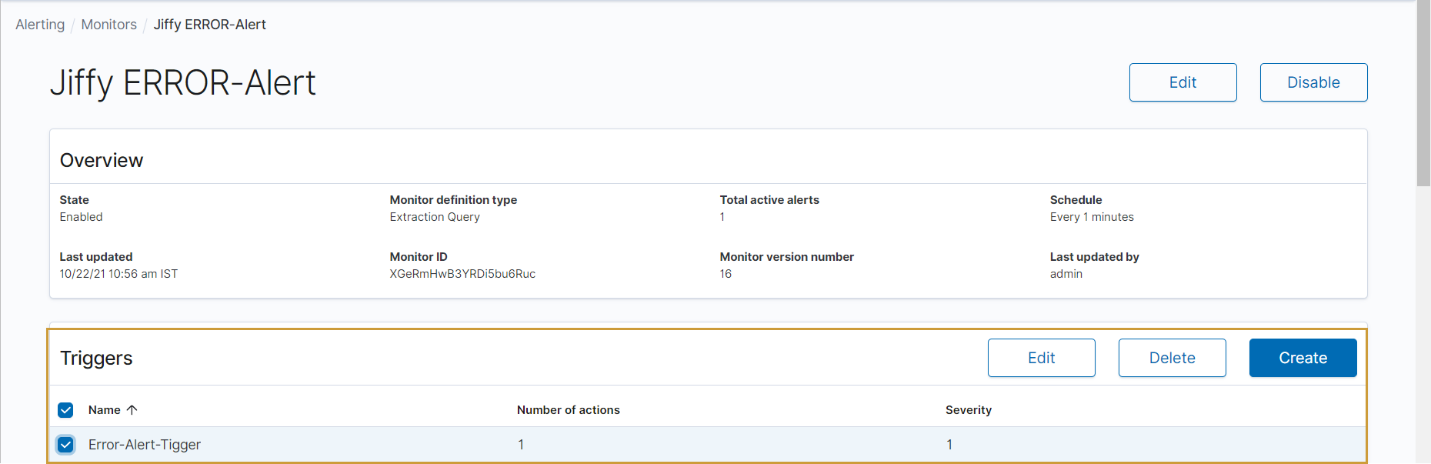
If Conditions specified in the Monitor section are met, Alerts are triggered.
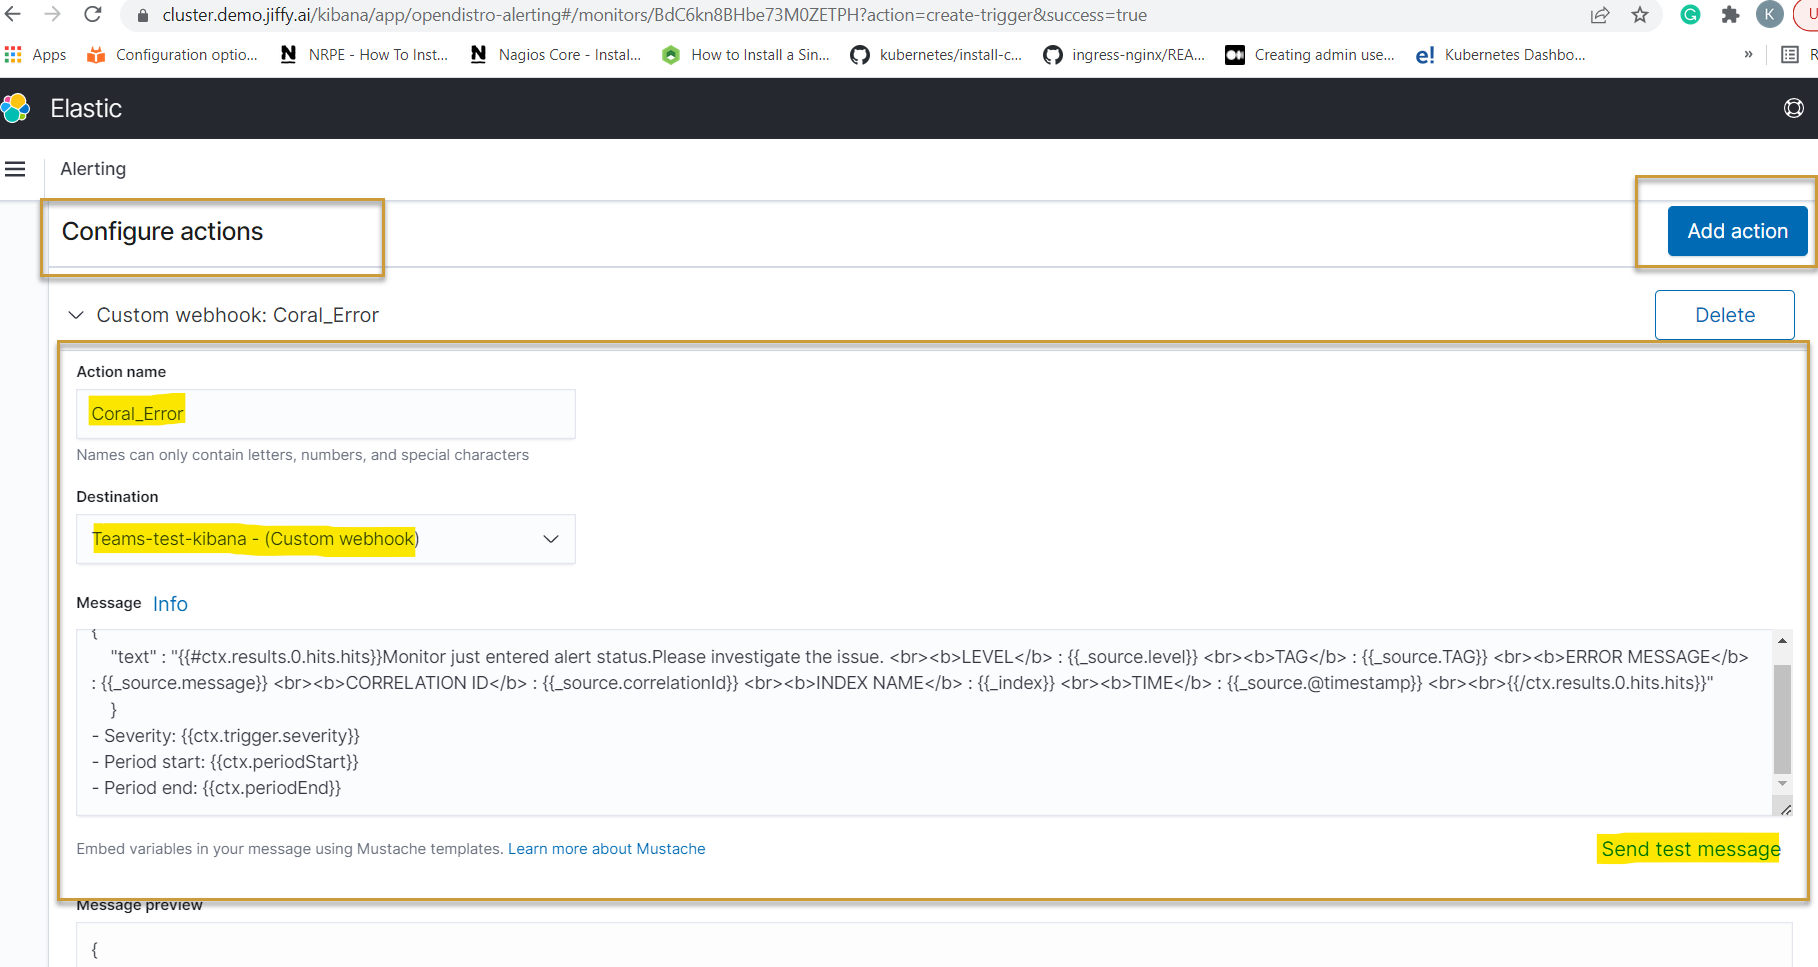
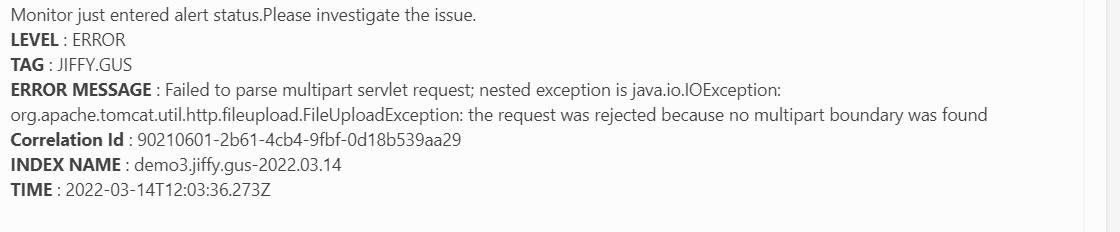
{{#ctx.results.0.hits.hits}}Monitor just entered alert status.Please investigate the issue. LEVEL : {{_source.level}} TAG: {{_source.TAG}} ERROR MESSAGE: {{_source.message}} CORRELATION ID: {{_source.correlationId}} INDEX NAME : {{_index}} TIME : {{_source.@timestamp}} {{/ctx.results.0.hits.hits}}
{ "text" : "{{#ctx.results.0.hits.hits}}Monitor just entered alert status.Please investigate the issue.
LEVEL : {{_source.level}}
TAG : {{_source.TAG}}
ERROR MESSAGE : {{_source.message}}
CORRELATION ID : {{_source.correlationId}}
INDEX NAME : {{_index}}
TIME : {{_source.@timestamp}}
{{/ctx.results.0.hits.hits}}" }
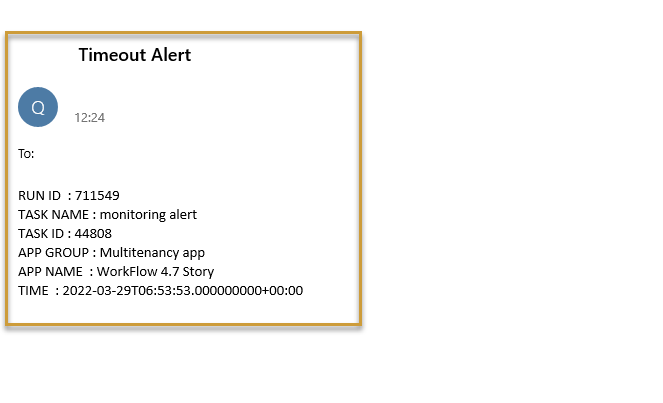
When an alert is triggered, the information related to the issue is sent to the recipients specified in the Destination.
To know more about Alerting in Kibana, click here.