Customize Presentation
Last Updated: May 10, 2022
Last Updated: May 10, 2022
Edit the Presentations to enhance the visual effects, make it more readable and provide meaningful insights.
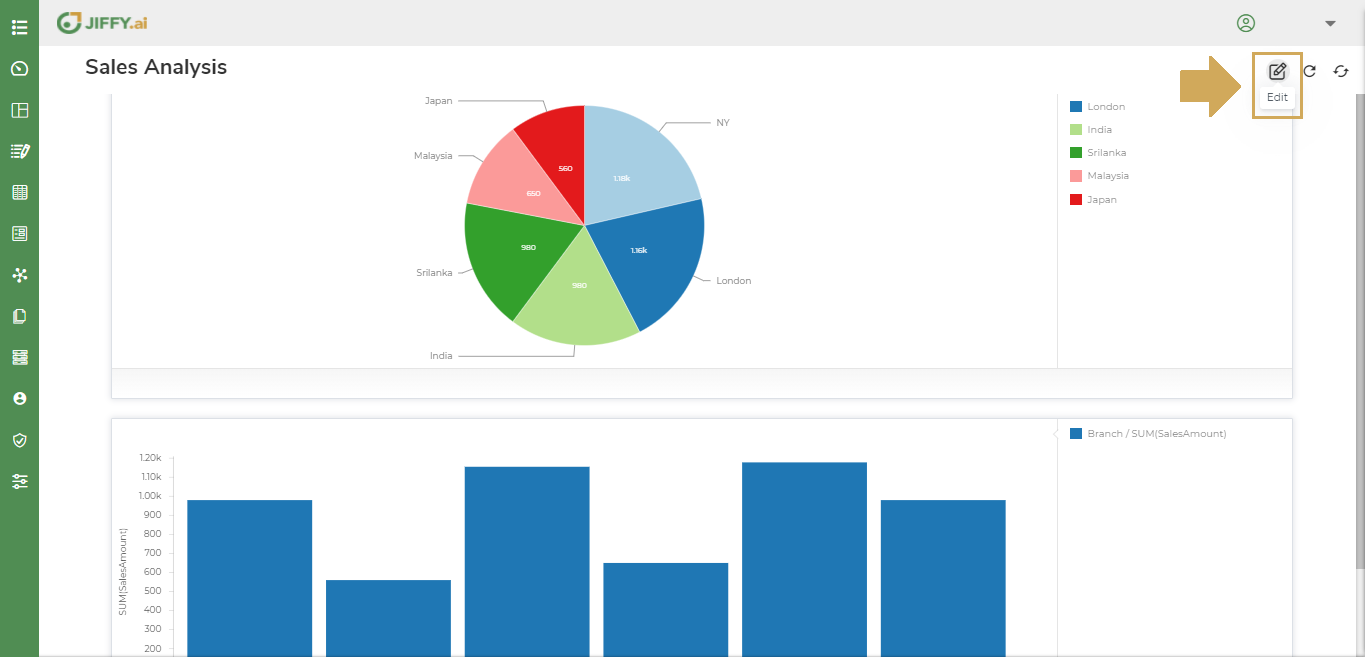
Click the ![]() icon to edit the Presentation.
icon to edit the Presentation.
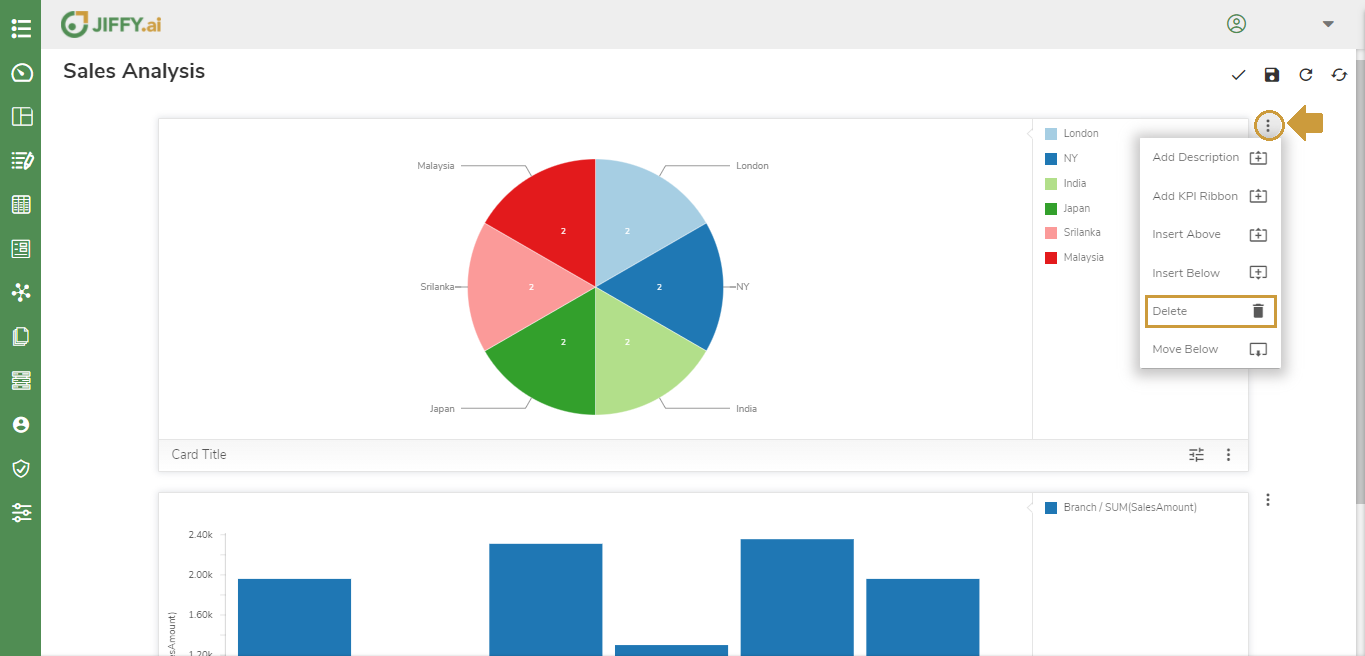
Click the ![]() icon to customize the Presentation.
icon to customize the Presentation.
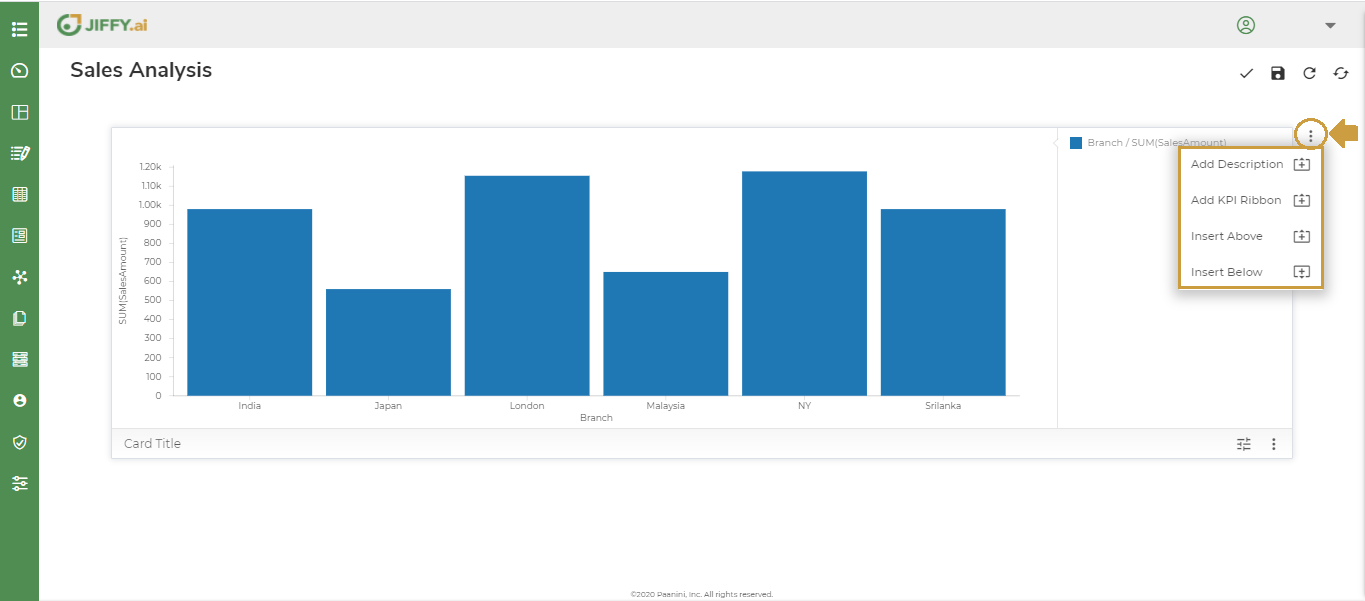
Following options are available.
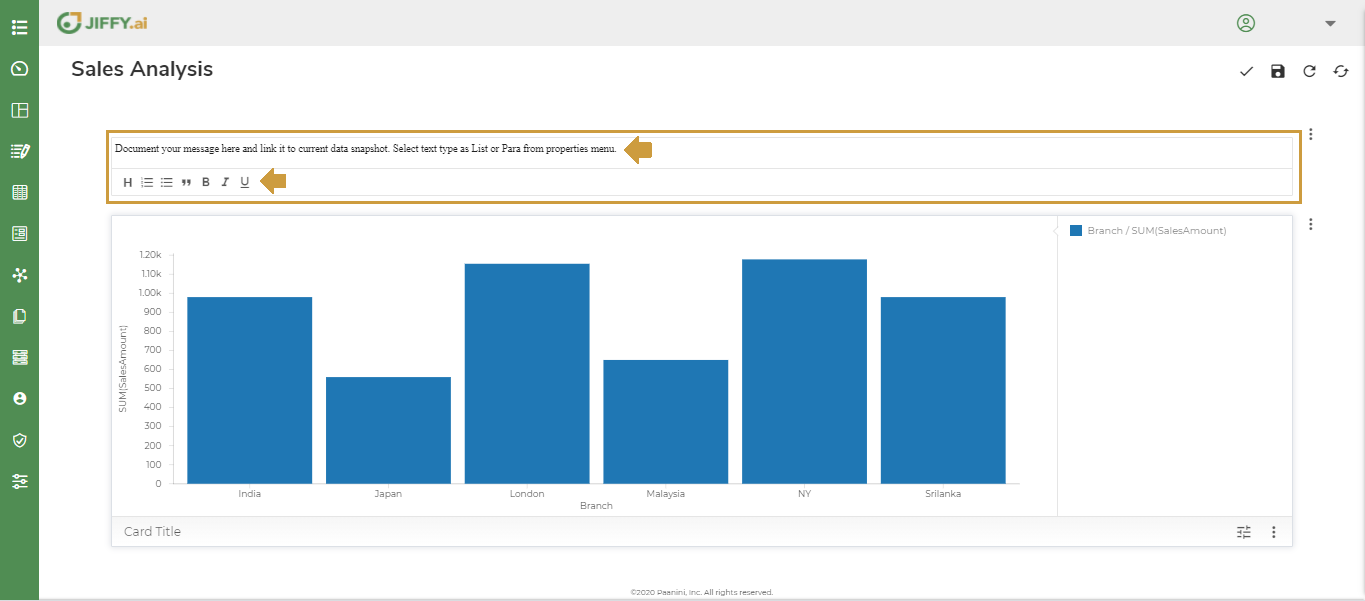
Use this option to give a meaningful description for the Presentation.
Select Add Description from the dropdown.
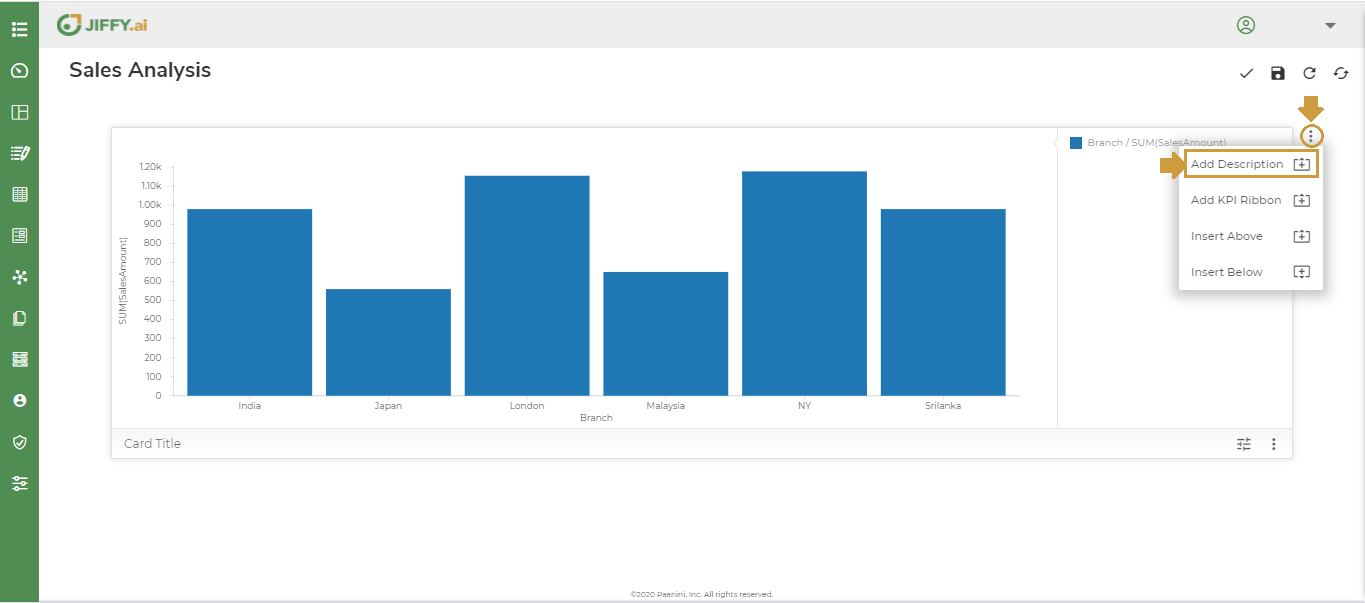
Enter the required description.
Use formatting options for formating the text.
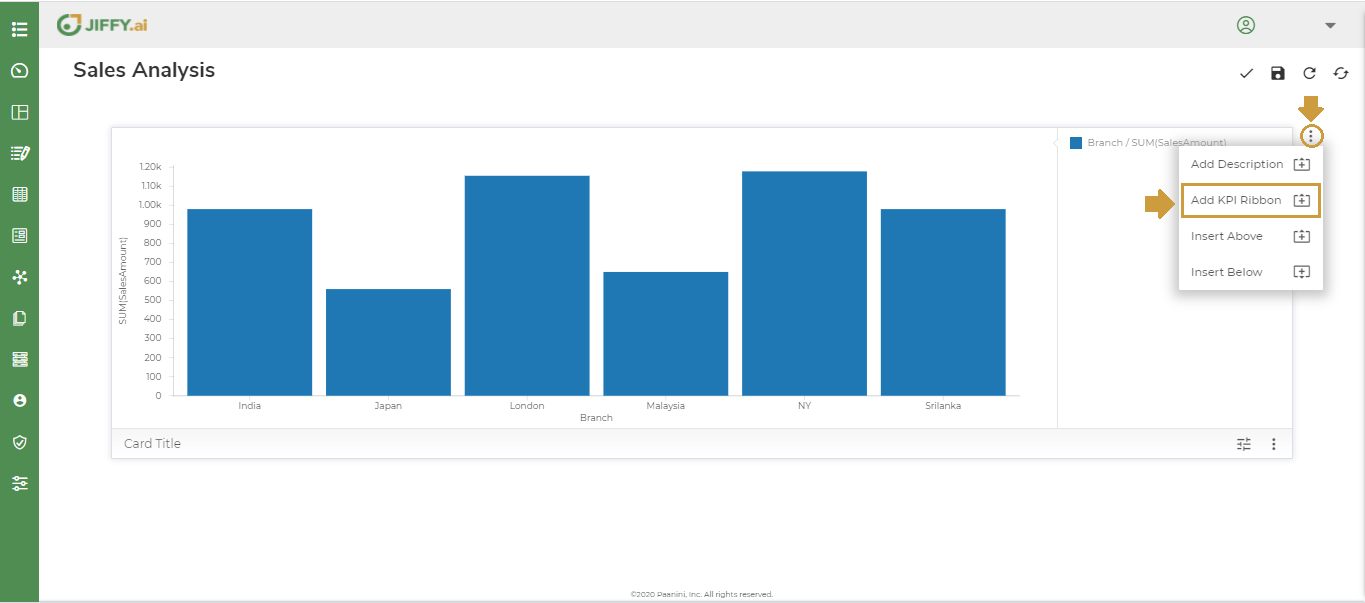
Use this option to add Key Performance Indicators to provide Business Users a summarized view on the critical data.
Select Add KPI Ribbon from the dropdown.
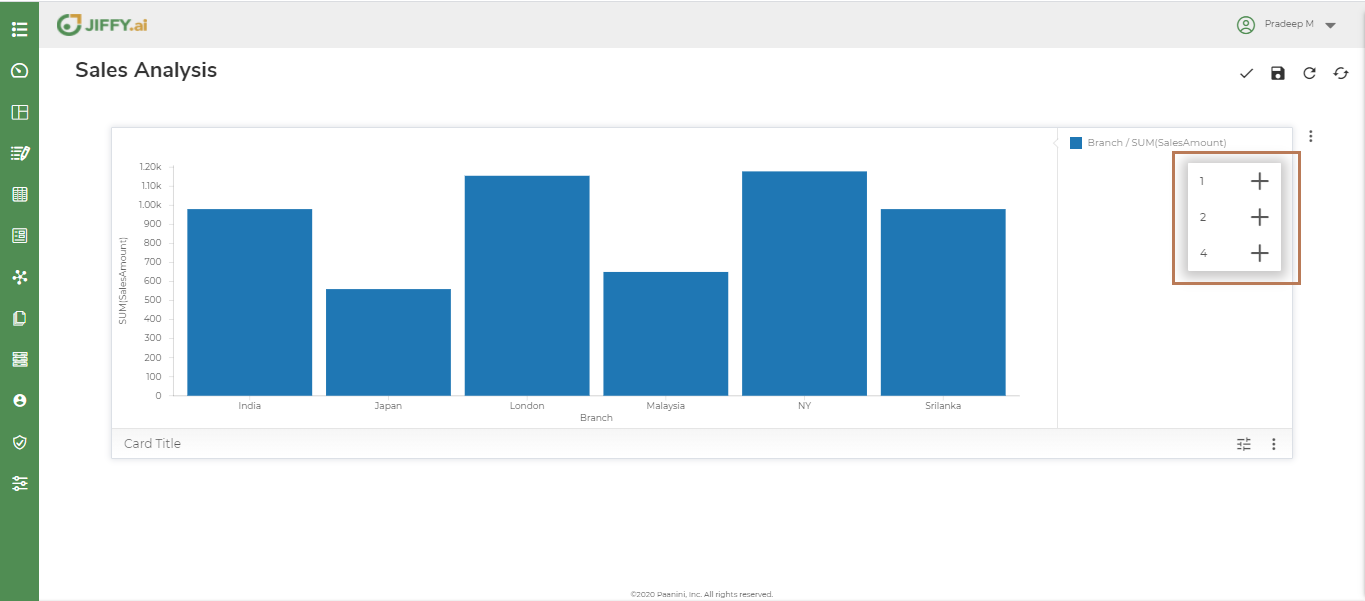
Select the number of KPI Ribbons you desire to add.
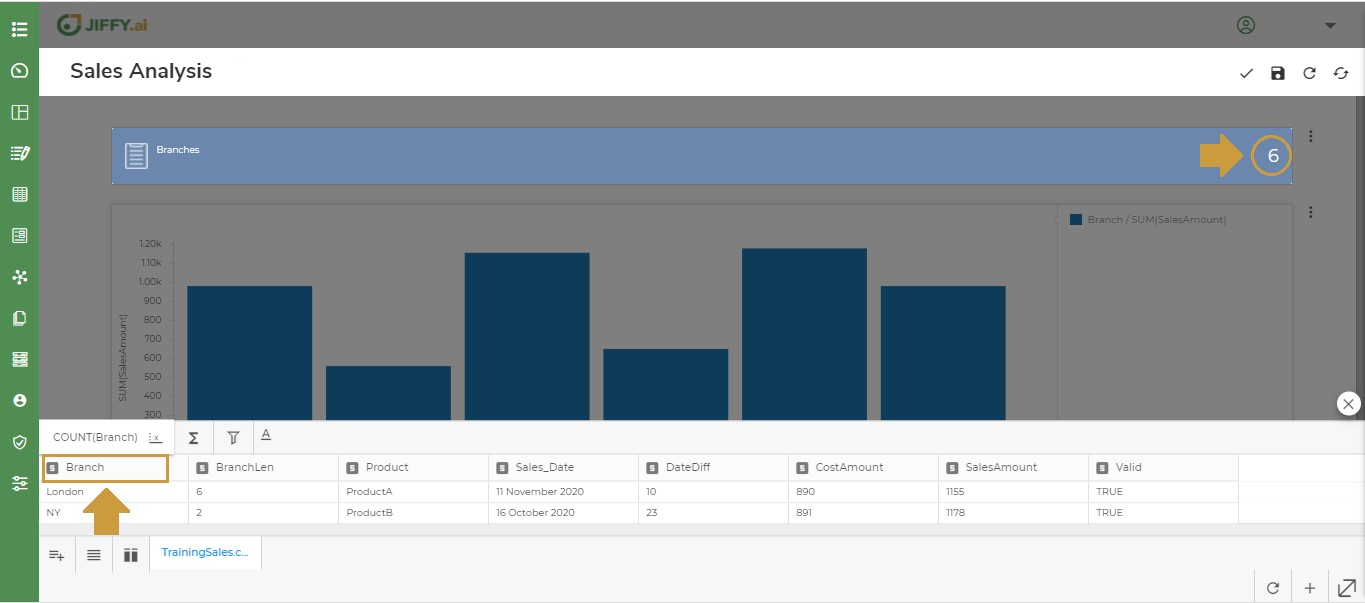
Click the Title and edit the ribbon title. For example, Branches
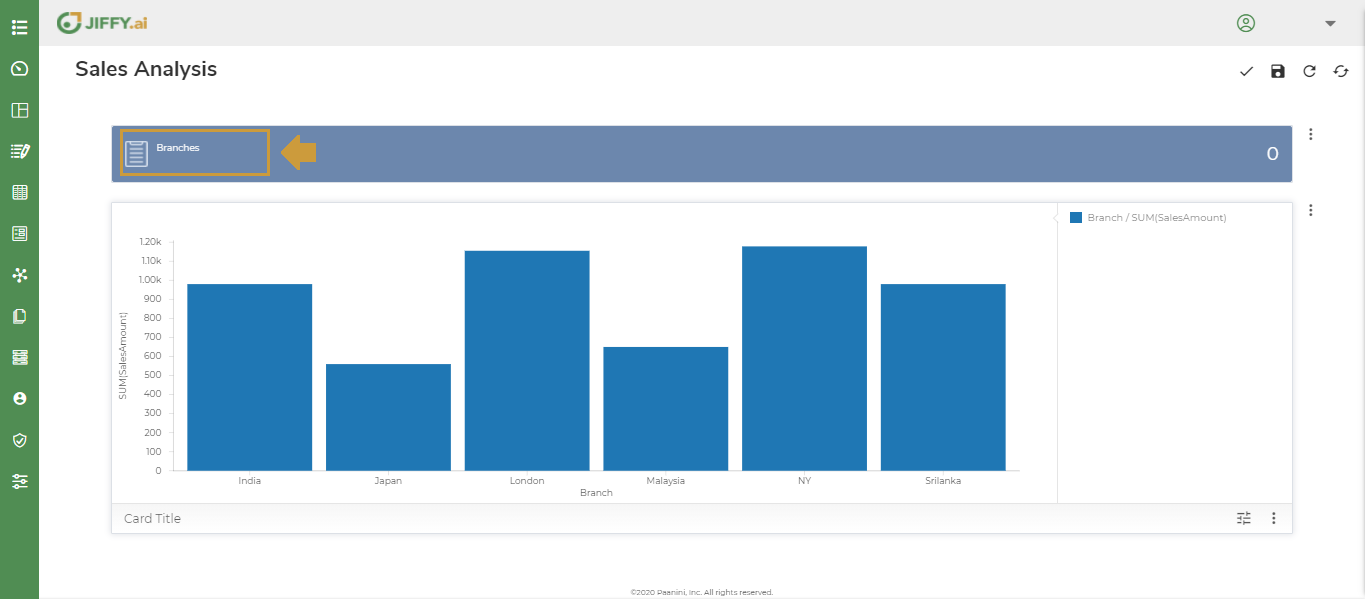
Click the Indicator number to add the required field for the indicator. For example, select Branch field to display number of branches as Indicator.

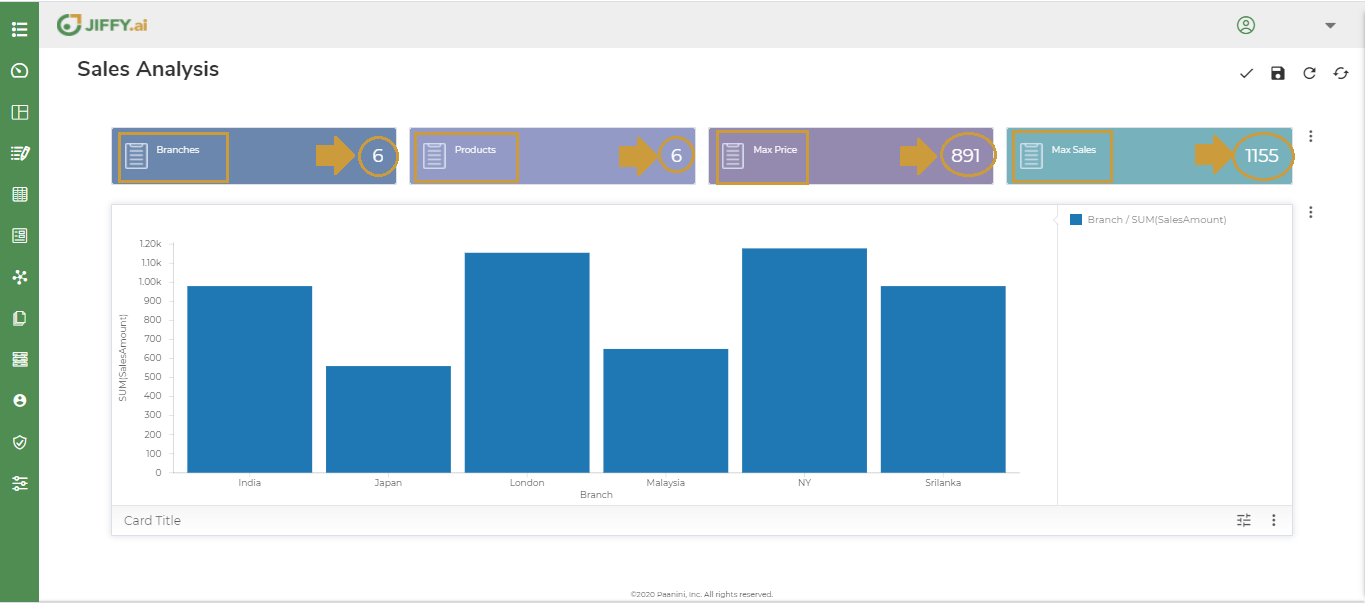
Based on the number of ribbons selected, you can add one or more KPI’s.
In the below example, four ribbons are added to indicate, Number of Branches, Number of Products, Max Product Price, and Max Sales.
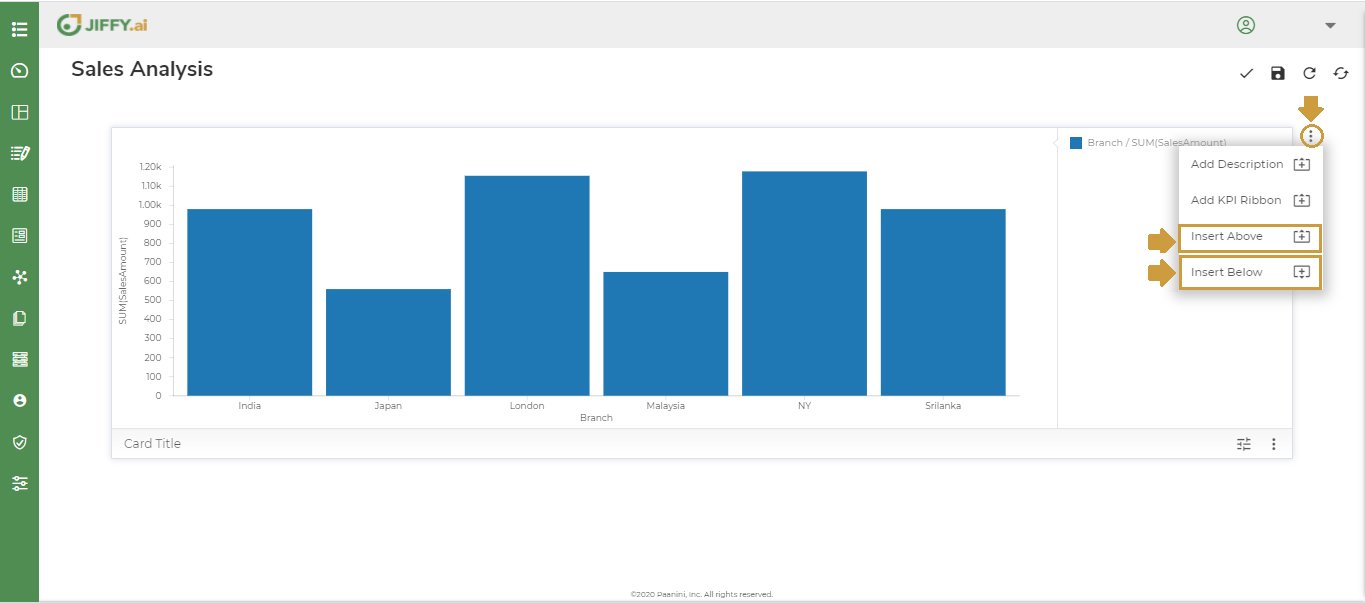
You can add more Presentations either above or below the existing Presentation, using the Insert Above or Insert Below option respectively.
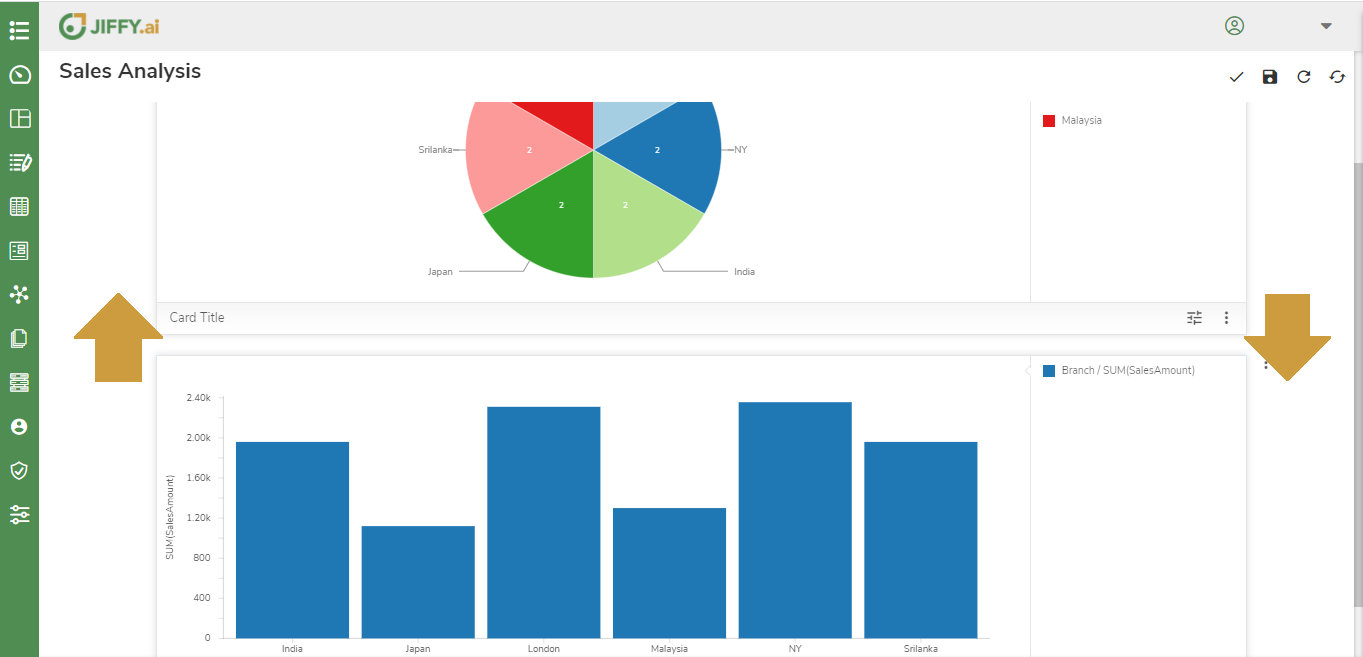
You can move the Chart either Above or Below in the Presentation layout.
Either of the icons appear based on the position of the selected Chart. Select the required option and change the Chart position.
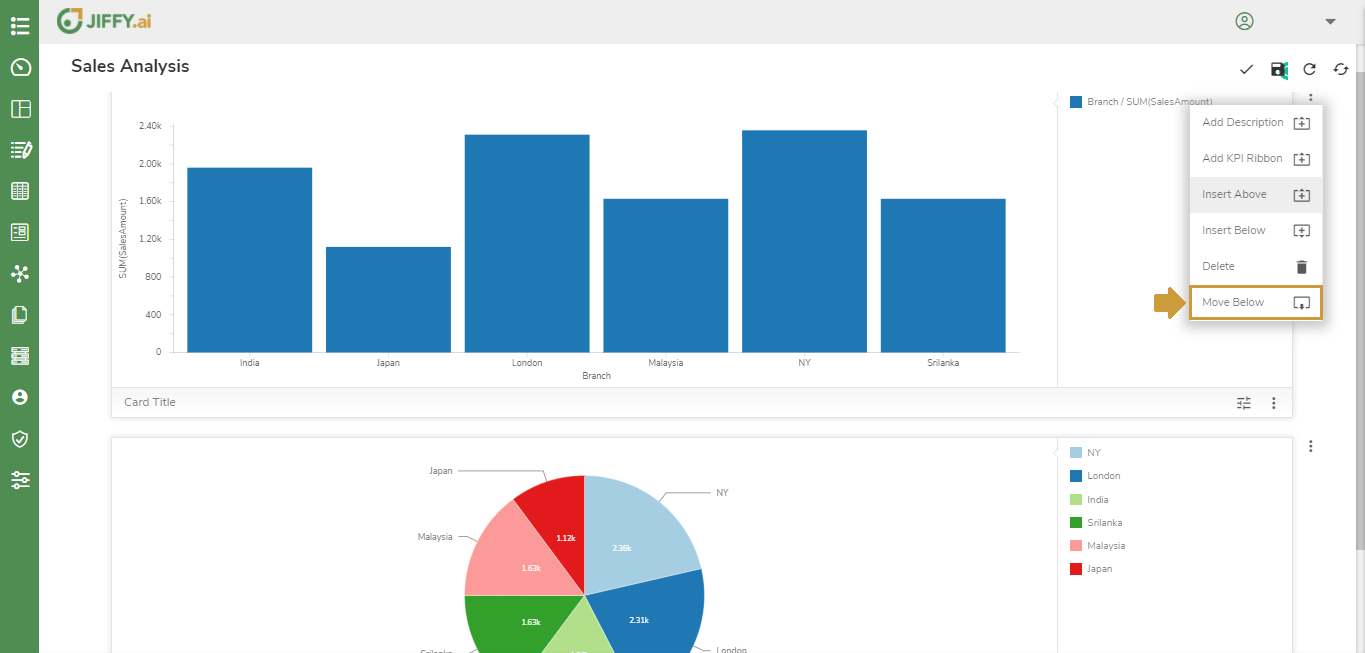
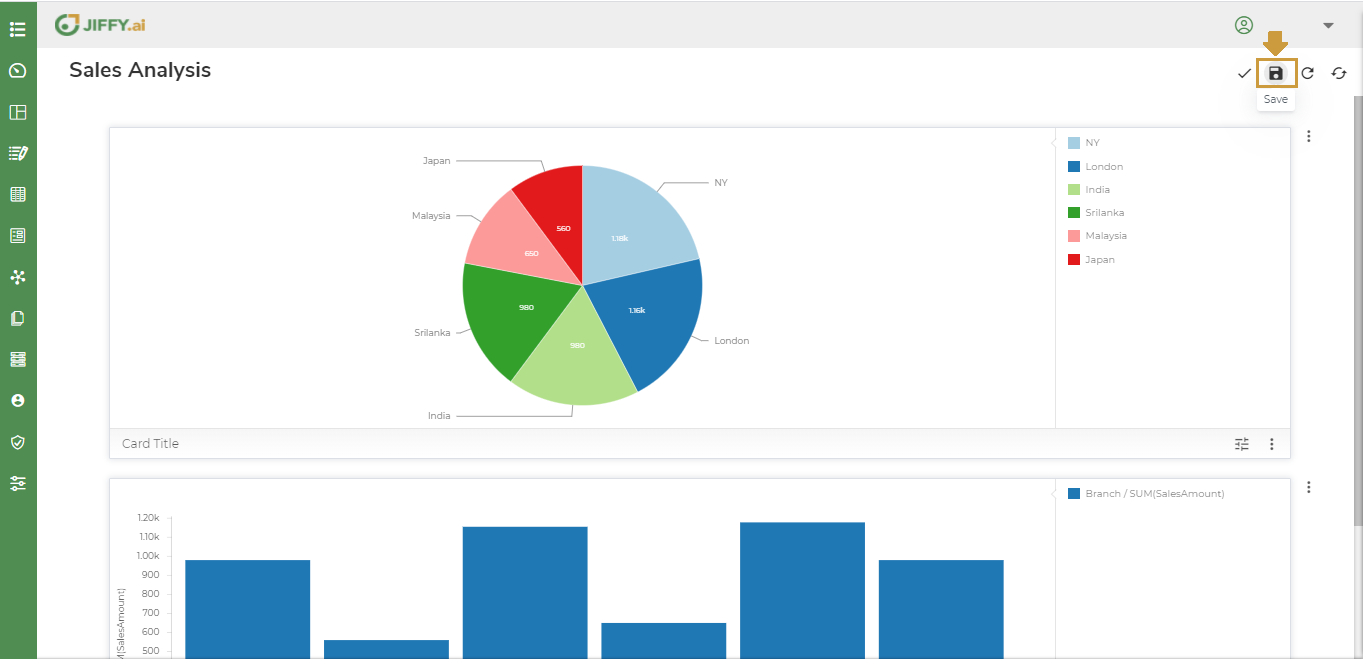
In the below example the Vertical Bar Chart is moved below the Pie Chart.
Use this option to delete the Chart from the Presentation layout.
Select Delete option from the dropdown.
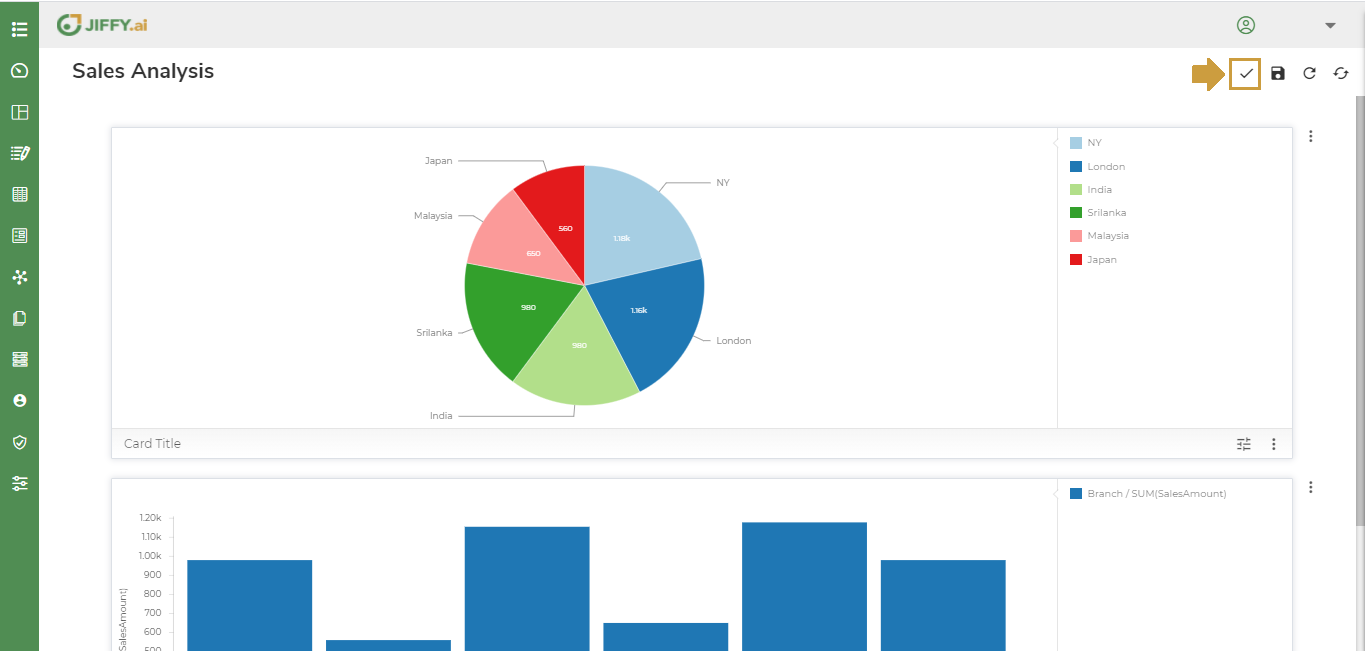
Click the ![]() icon to display the changes.
icon to display the changes.
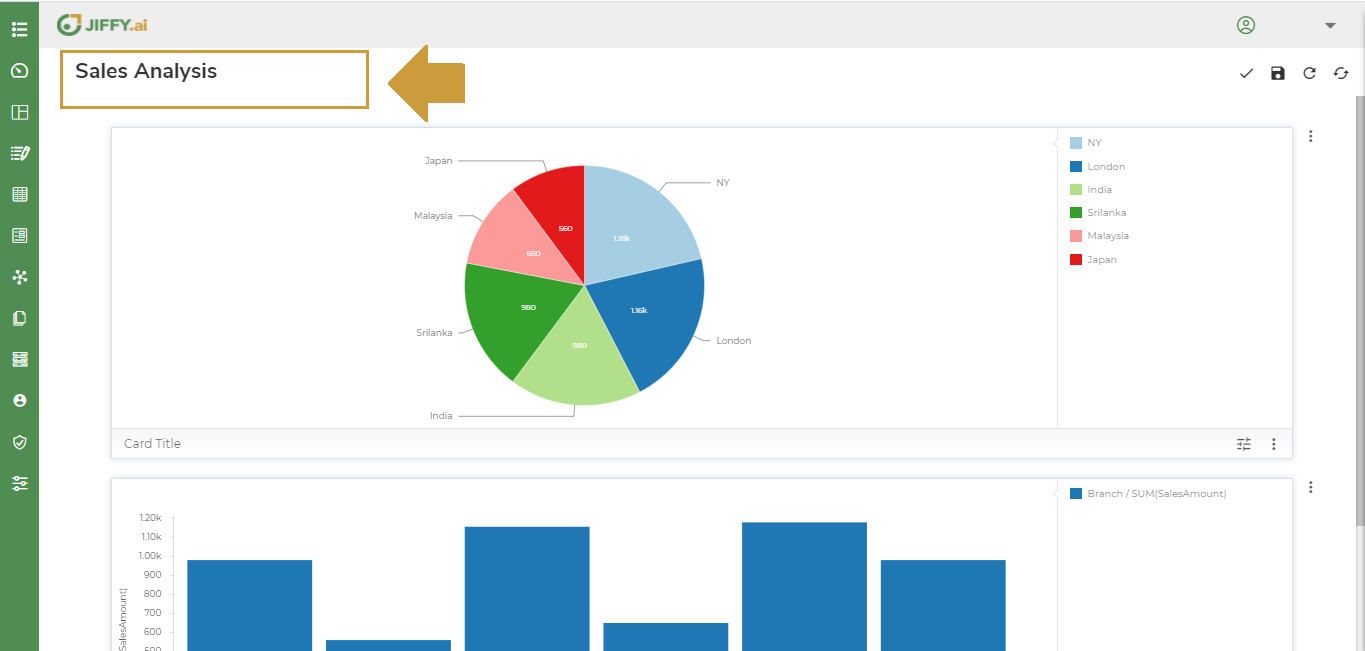
Provide a meaningful name to the Presentation.
Click the ![]() icon to save the changes.
icon to save the changes.
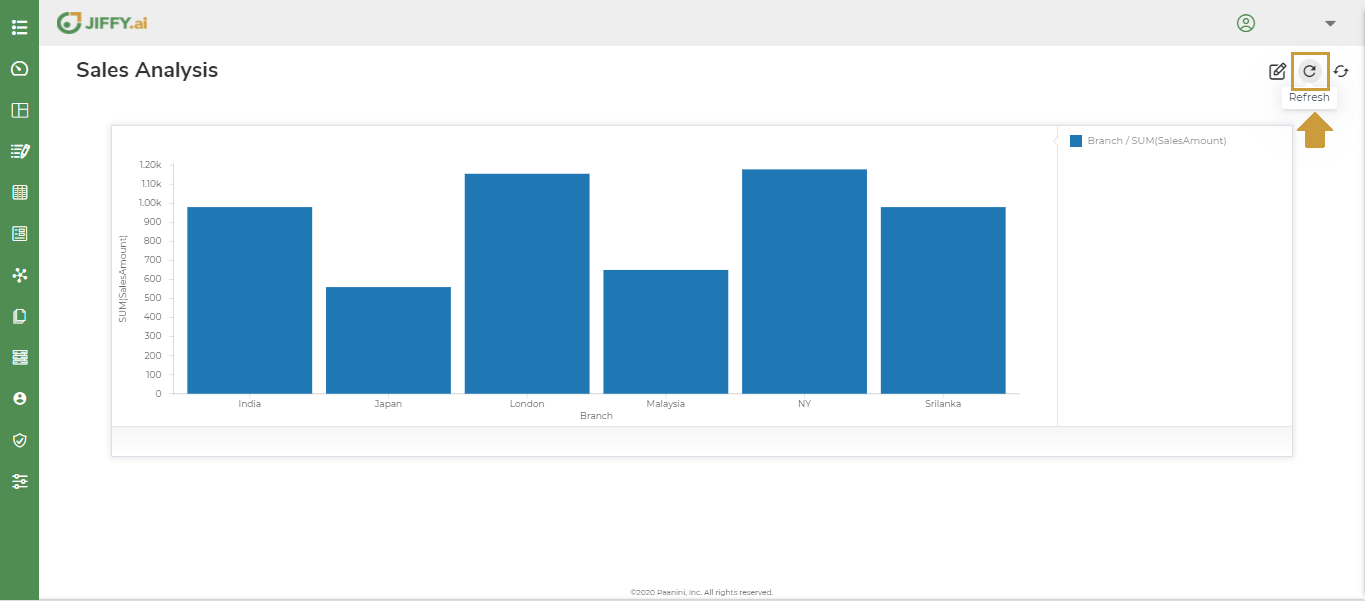
Click the ![]() icon to refresh the Presentation and reflect the changes, if any in the underlying datasets.
icon to refresh the Presentation and reflect the changes, if any in the underlying datasets.
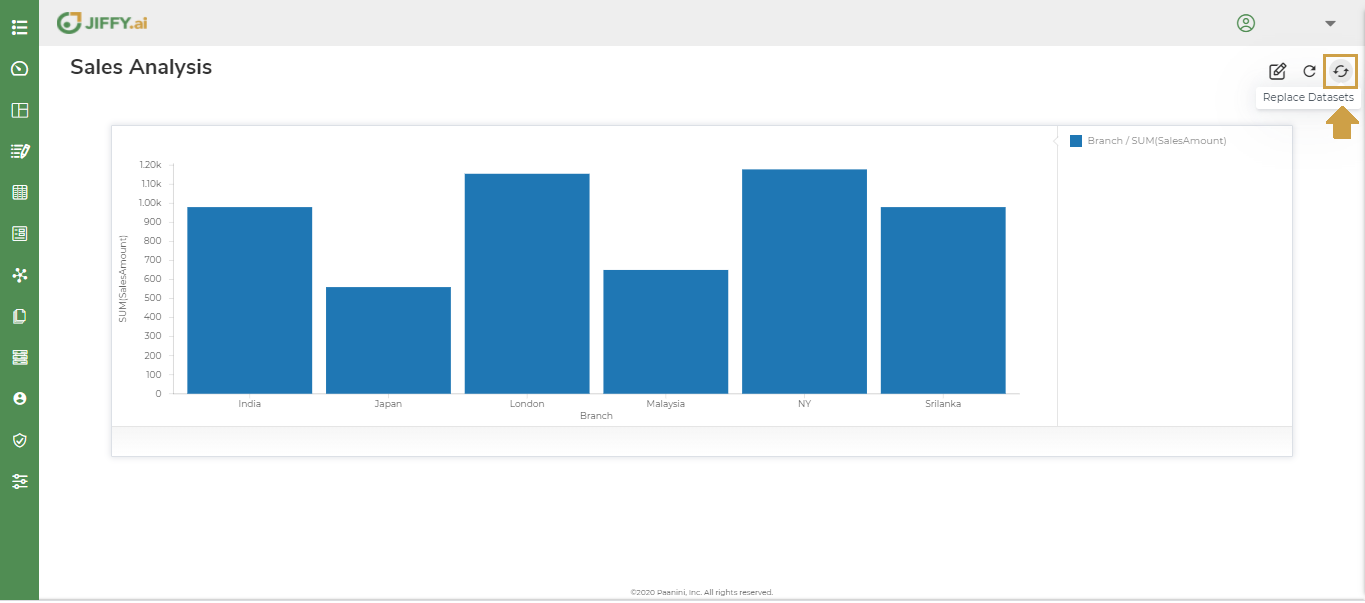
Use this option to replace the existing dataset.
Click the ![]() icon and choose the dataset as shown below.
icon and choose the dataset as shown below.
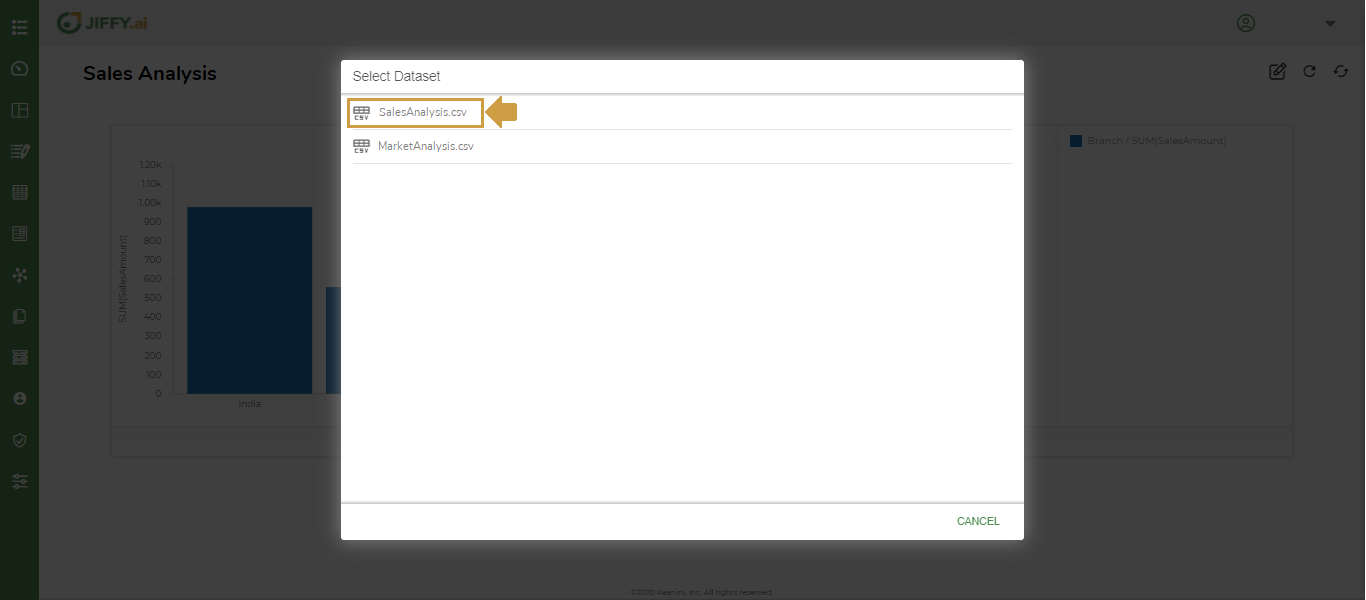
Click the ![]() icon. It lists all the datasets in the App.
icon. It lists all the datasets in the App.
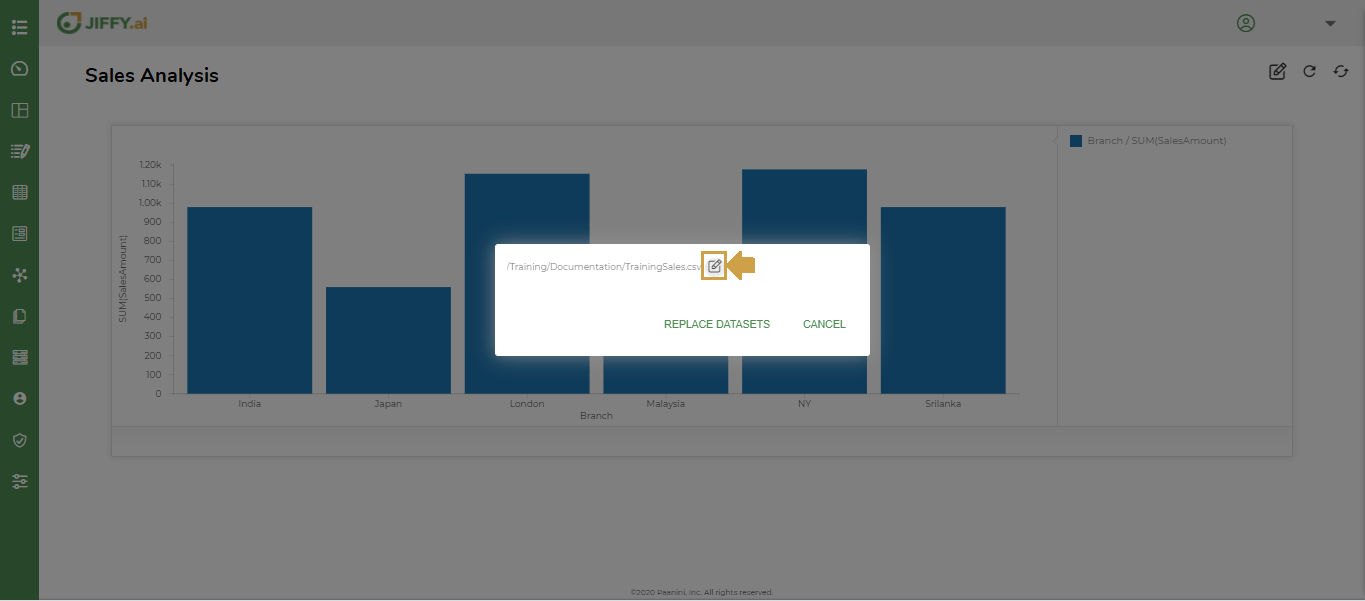
Select the required dataset. For example, SalesAnalysis.csv
Click the ![]() icon and
icon and ![]() icon, to display the changes in the Presentation with the new dataset values.
icon, to display the changes in the Presentation with the new dataset values.
Click the ![]() icon below the Chart you wish to customize.
icon below the Chart you wish to customize.
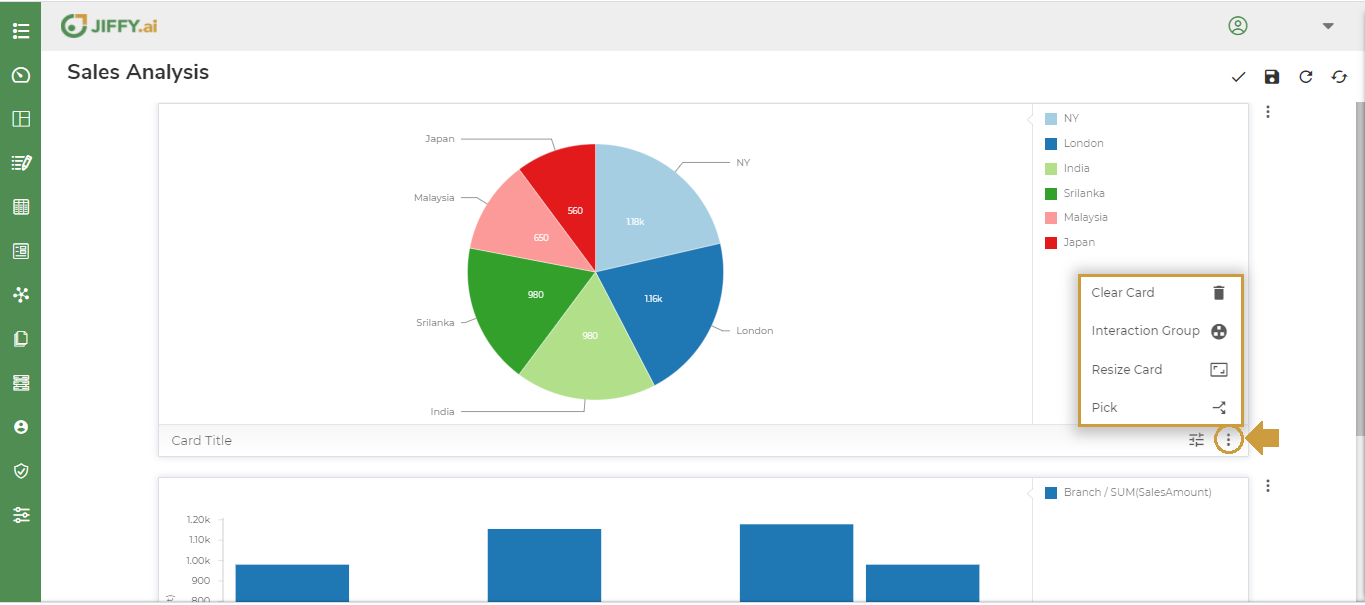
Following options are available.
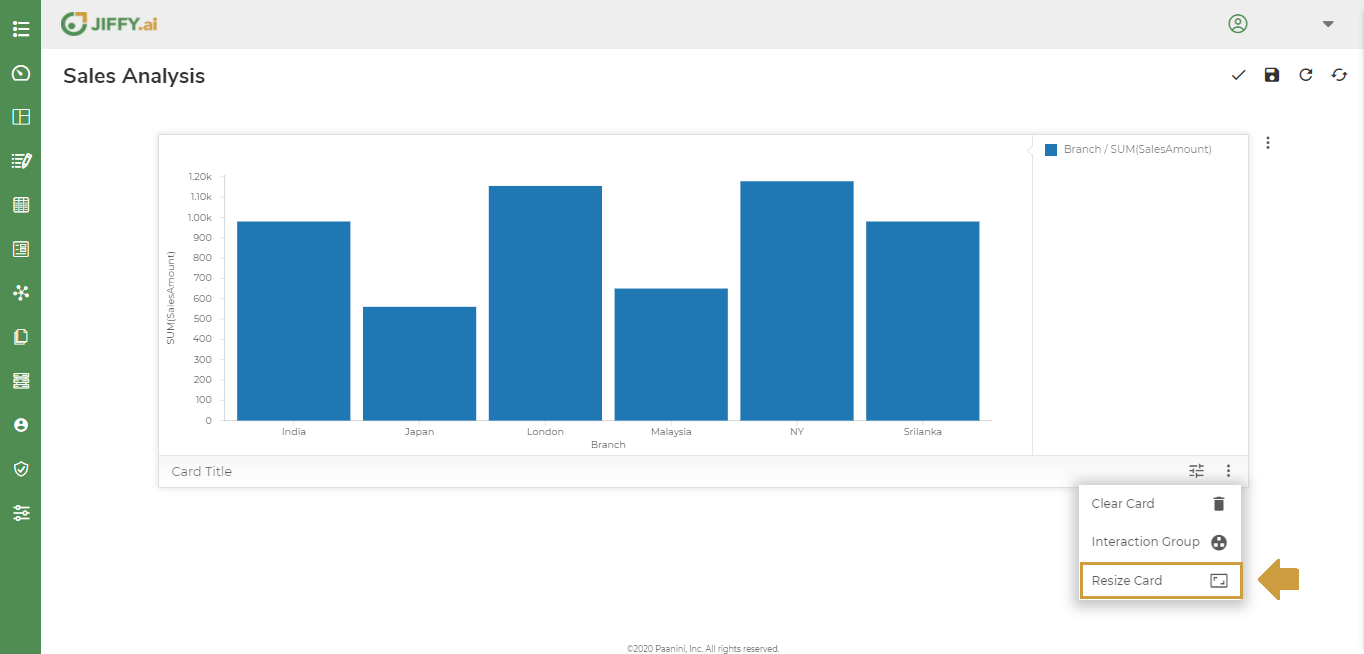
With this option, you can reduce the size of the existing Chart to create multiple Charts on the same Presentation layout.
Select the Resize Card option.
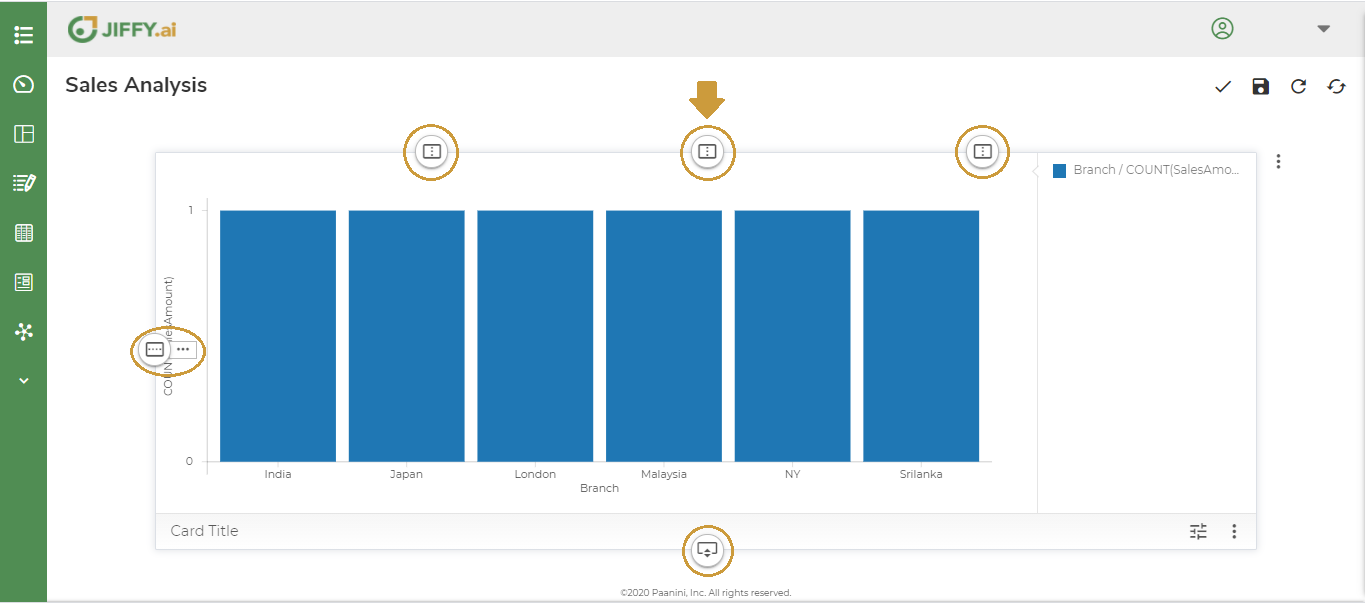
Select the ![]() icon on the desired position. For example, If you select the position as shown below, the Chart resizes and then you can add another Chart on the right of the layout.
icon on the desired position. For example, If you select the position as shown below, the Chart resizes and then you can add another Chart on the right of the layout.
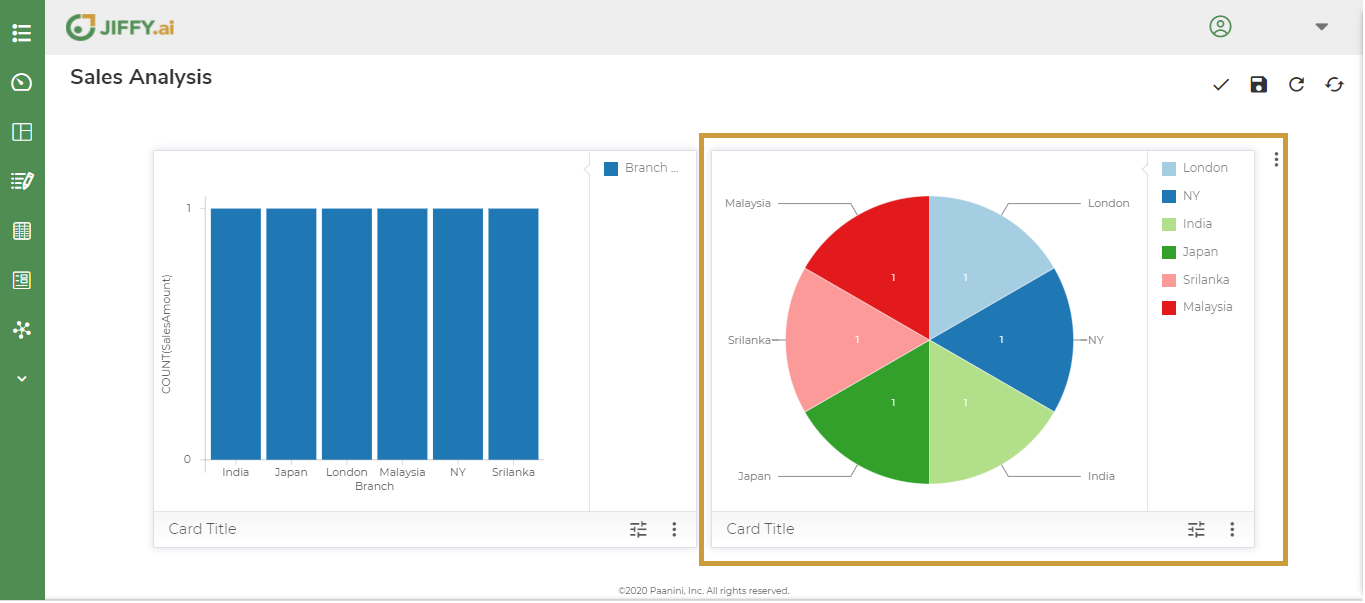
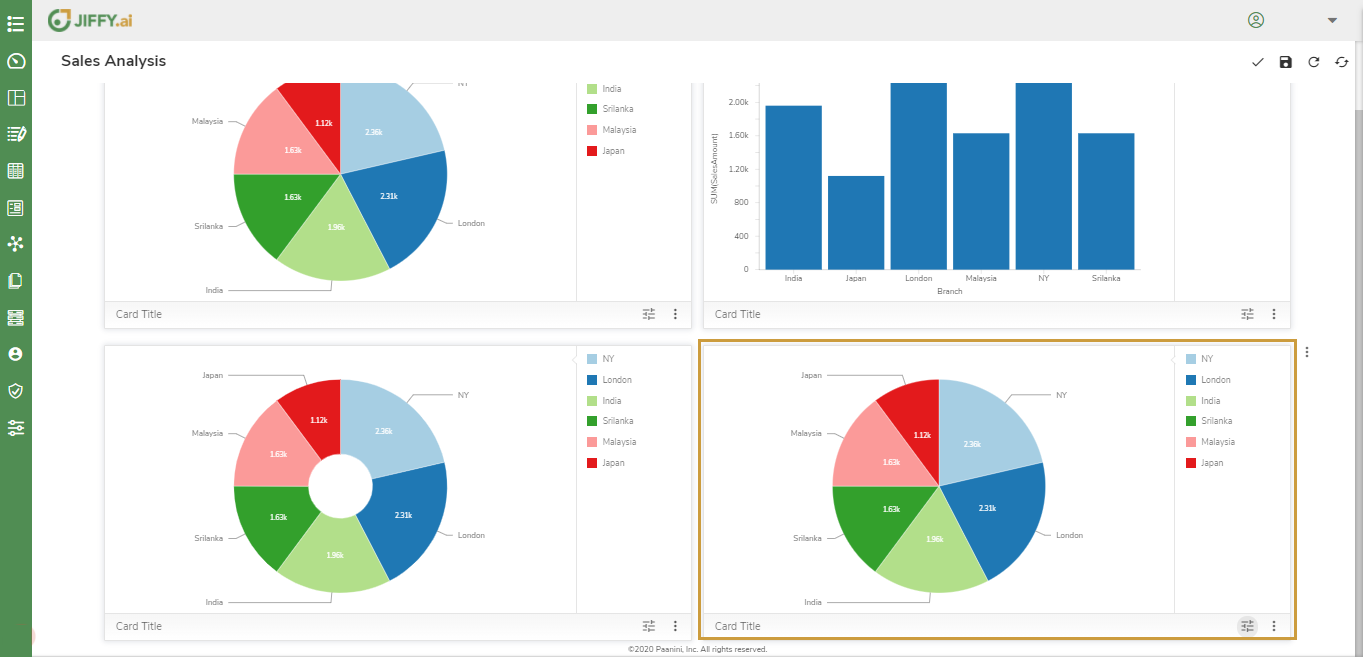
 In the below example, a Pie Chart is added after resizing.
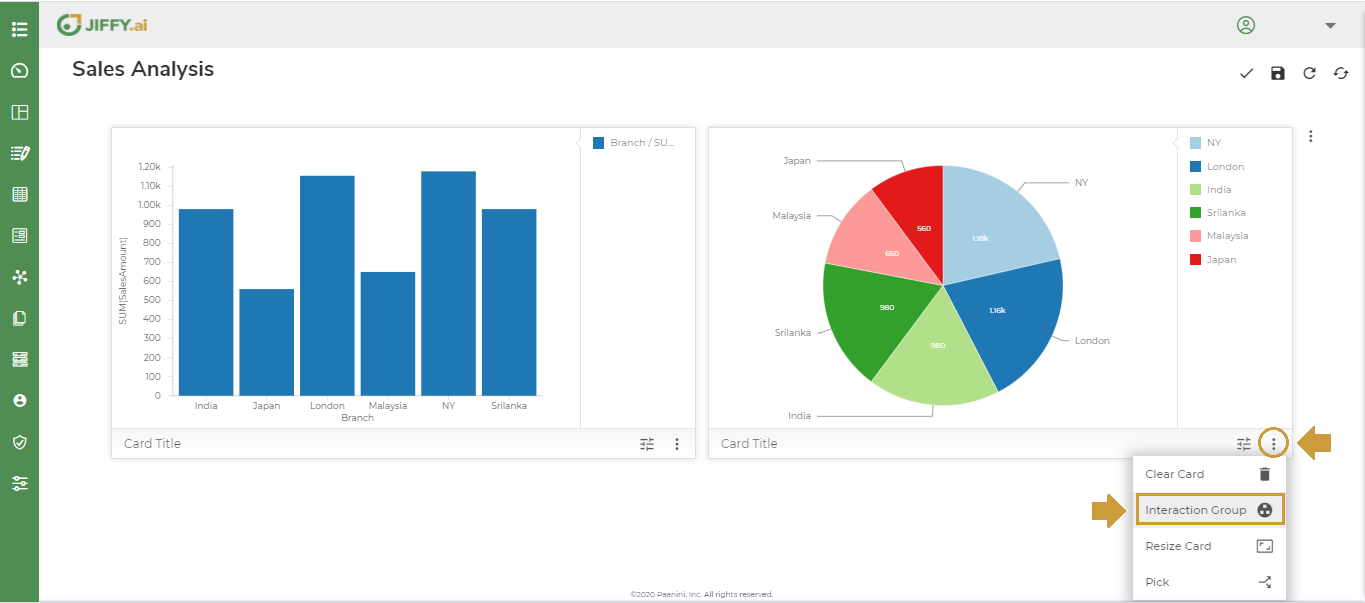
Use this option to add interactivity between the Charts. For example, when you filter one Chart to view data specific to the filter condition, the other Charts in the Presentation displays data specific to the same filter condition.
To create Interaction Group in the Presentation, click the ![]() icon on any one of the desired Charts and select the Interaction Group option.
icon on any one of the desired Charts and select the Interaction Group option.
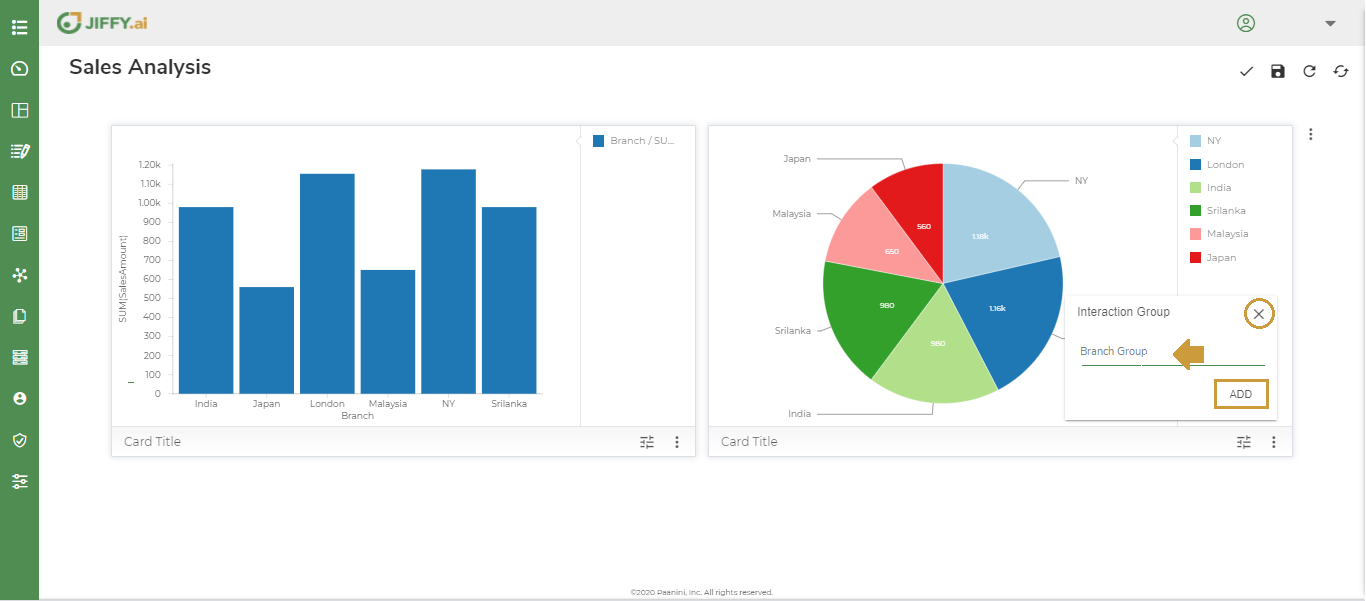
Enter a meaningful name for Interaction Group . For example, Branch Group and click the ADD button.
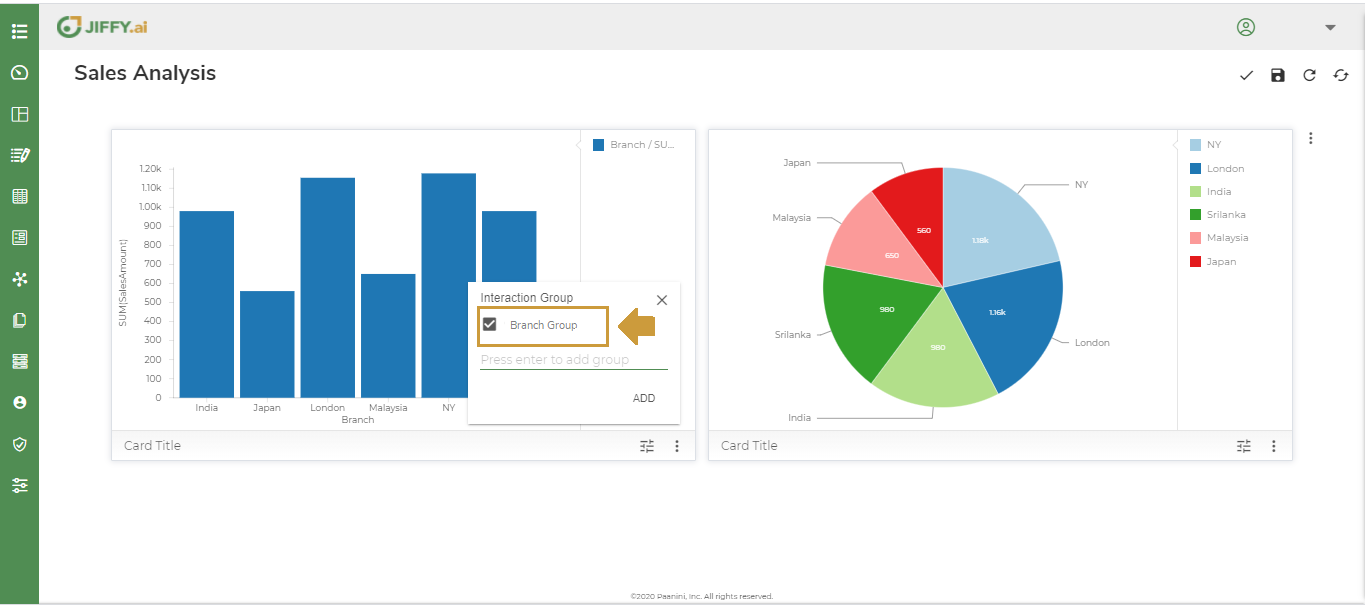
Select the same Interaction Group in the other Chart.
Click the ![]() icon in the Vertical Bar Chart and select the Interaction Group Branch Group.
icon in the Vertical Bar Chart and select the Interaction Group Branch Group.
Select the Branch NY in the Pie Chart, then the corresponding Branch NY in the Vertical Bar Chart is also highlighted.
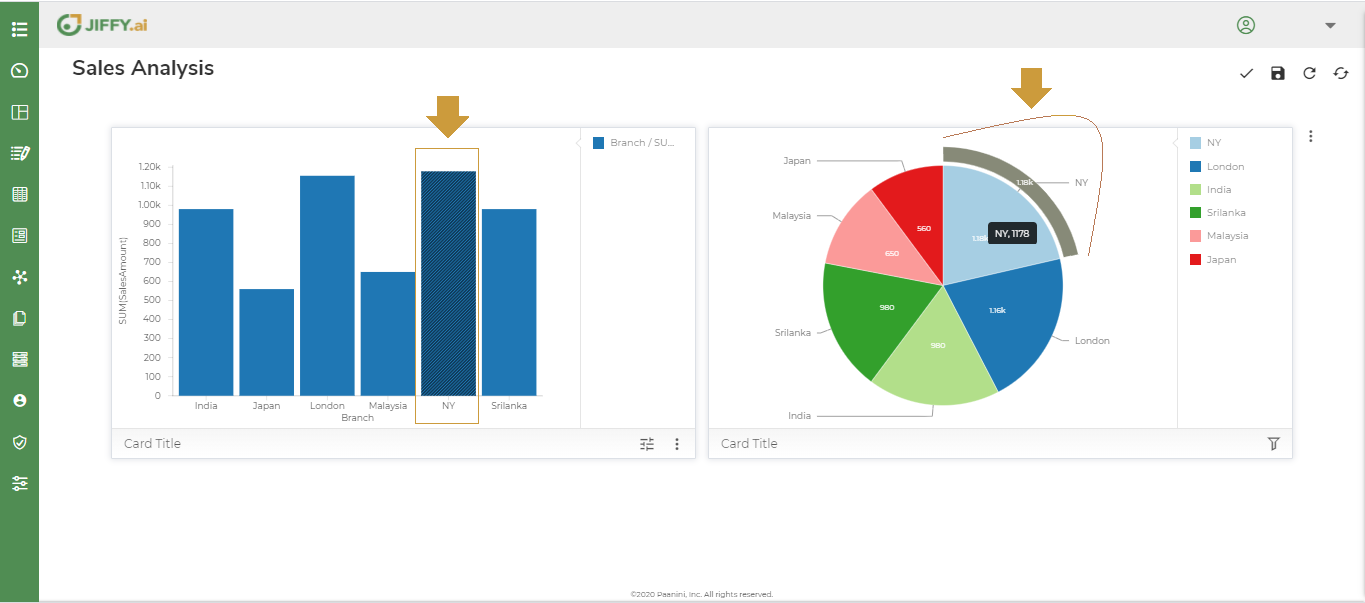 In the above example, when you select the filter condition of Branch NY in the Pie Chart, Vertical Bar Chart also reflects the same. All the Charts where the same interaction group is selected reflects the same filter condition, this is called whole to part view.
When you remove the filter on Pie Chart, it is also removed from the other interacting Charts and the whole view is displayed.
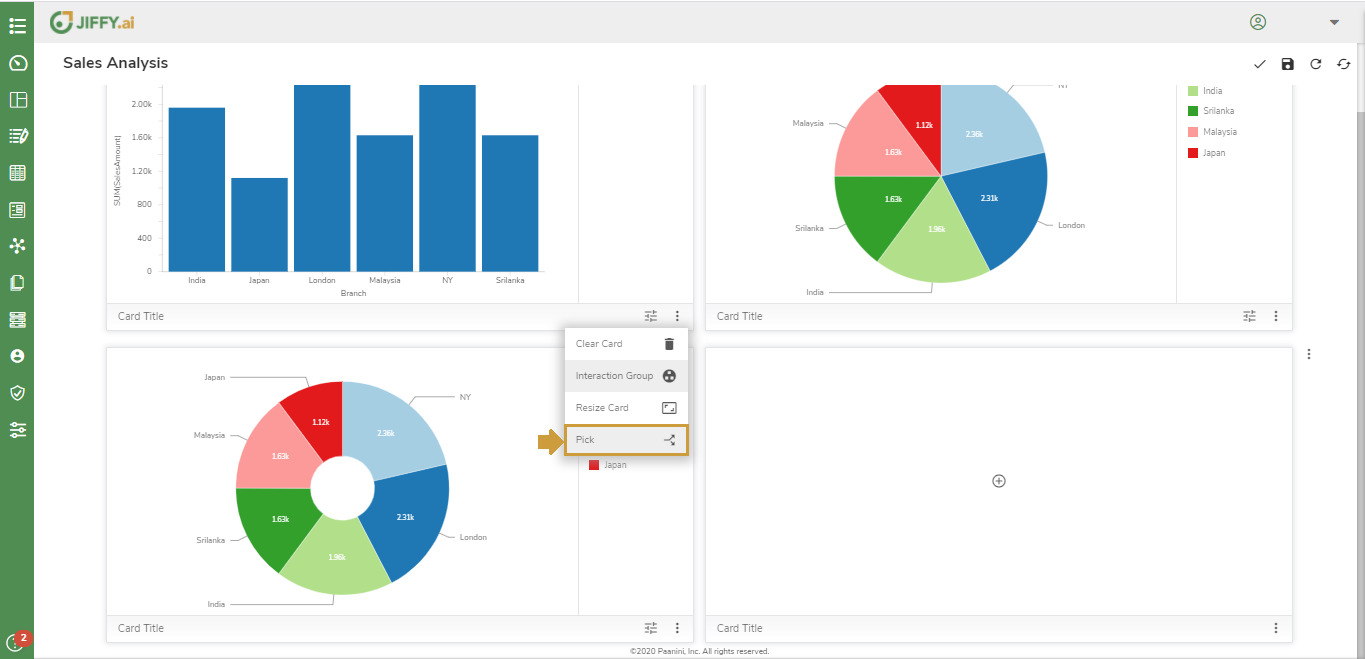
Use this option to swap the Chart positions in the Presentation layout.
Select the Pick option on the Chart you want to swap.
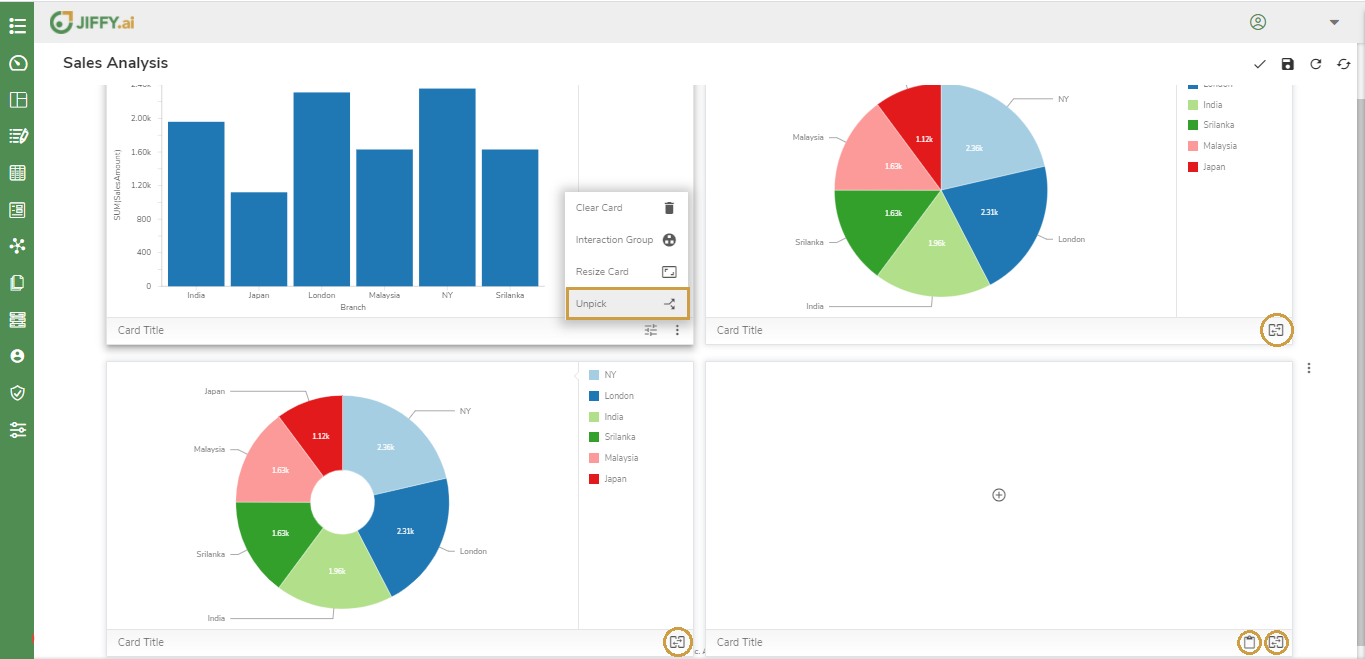
The Unpick option appears on the selected Chart, and the ![]() icon appears on all the other Charts of the presentation.
icon appears on all the other Charts of the presentation.
Click the ![]() icon of the Chart you desire to swap with.
icon of the Chart you desire to swap with.
Click the Unpick option on the selected Chart if you want to cancel the pick operation.
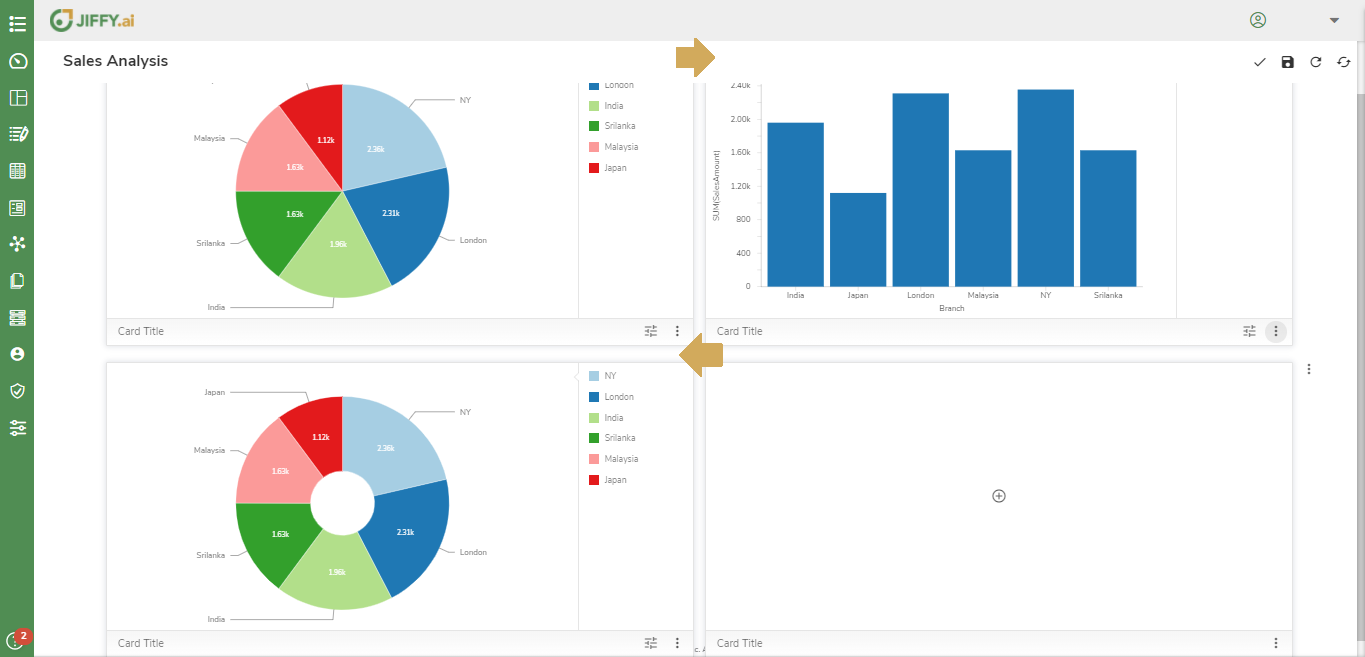
In the above example, if you click the ![]() icon below the Pie Chart, the Vertical Bar Chart and Pie Chart positions are swapped as shown below.
icon below the Pie Chart, the Vertical Bar Chart and Pie Chart positions are swapped as shown below.
If the Chart is blank, then ![]() icon also appears along with the
icon also appears along with the ![]() icon. You can click the
icon. You can click the ![]() icon to paste the Chart there or
icon to paste the Chart there or ![]() icon to swap with the position of blank Chart.
icon to swap with the position of blank Chart.
In the above example, if you select the Pick option below the Pie Chart and Click the ![]() icon below the empty Chart, the Pie Chart is pasted in the position of the empty Chart.
icon below the empty Chart, the Pie Chart is pasted in the position of the empty Chart.
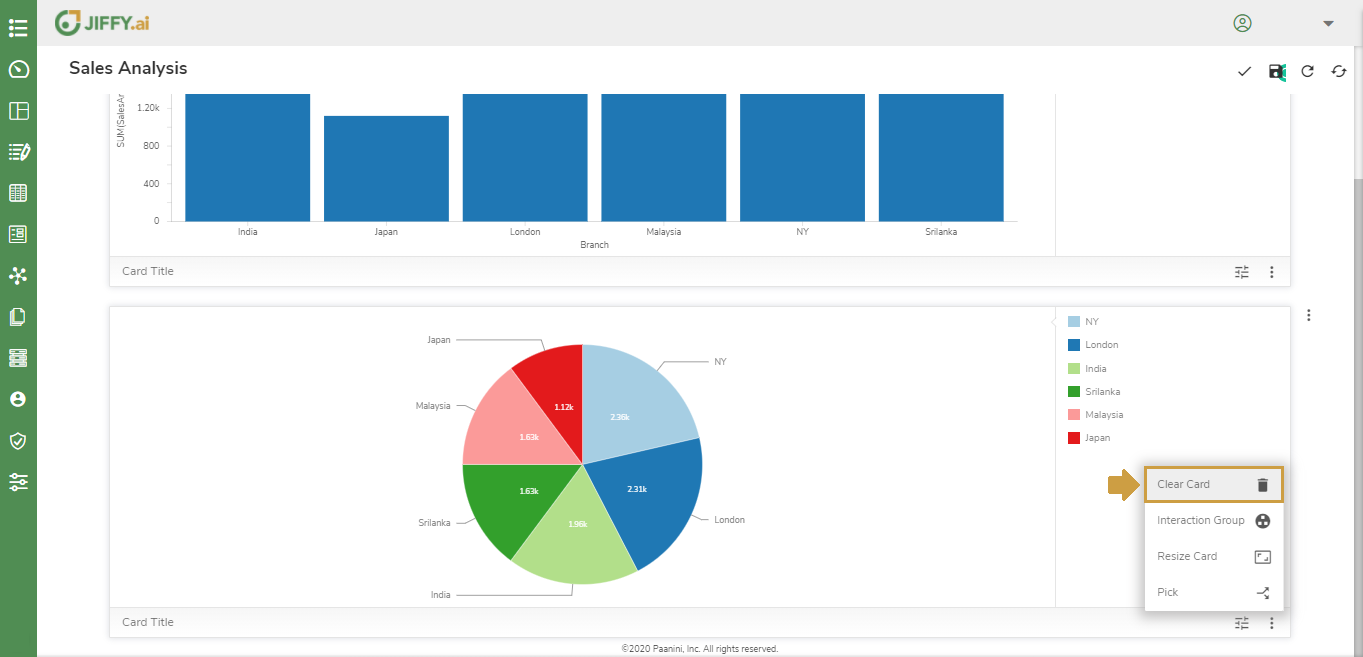
Use this option to clear the Chart and add another Chart type.
Click the Clear Card option.