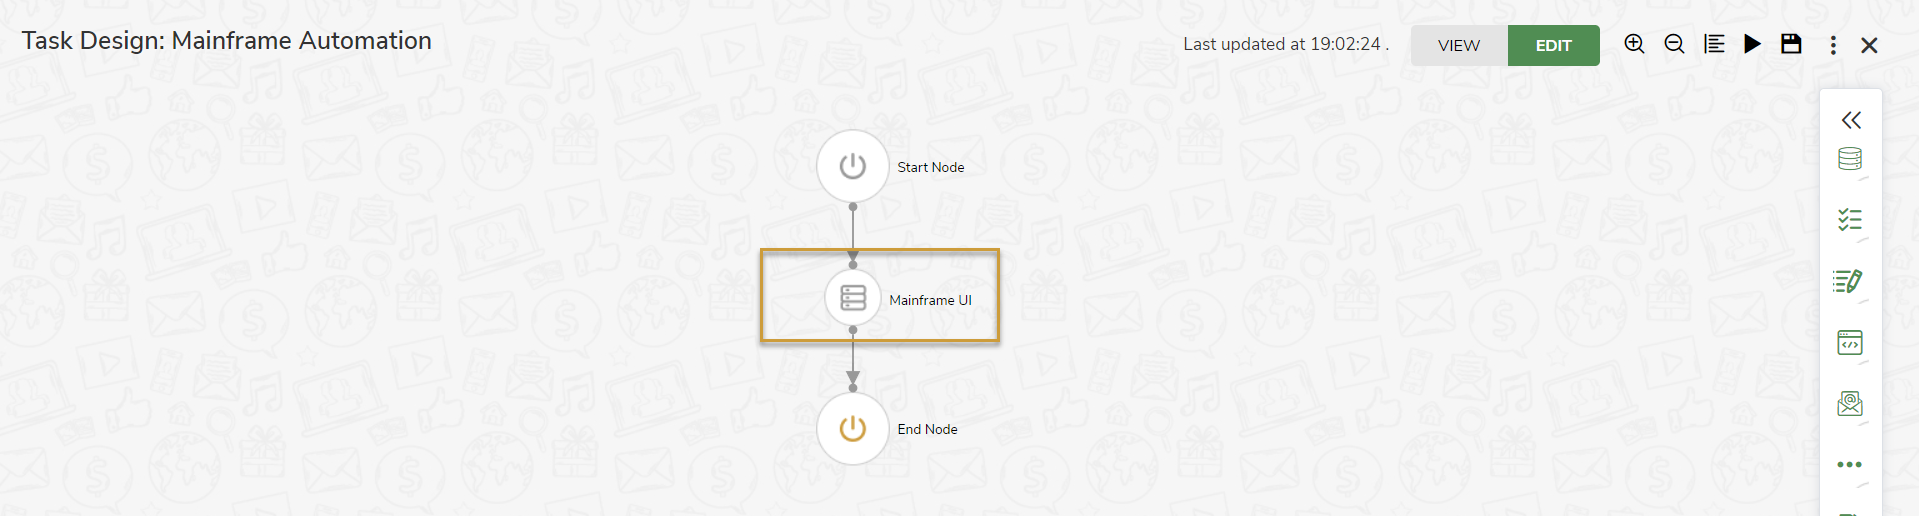
The Mainframe UI node is used to automate the Mainframe applications.
Consider a banking institution where mainframe is used to host the database of its customer accounts, for which transactions are submitted from any of thousands of ATM locations worldwide.
You can automate above process using the Mainframe UI node.
Configurations of Mainframe UI Node
- Click the Mainframe UI node to open the attributes pane.
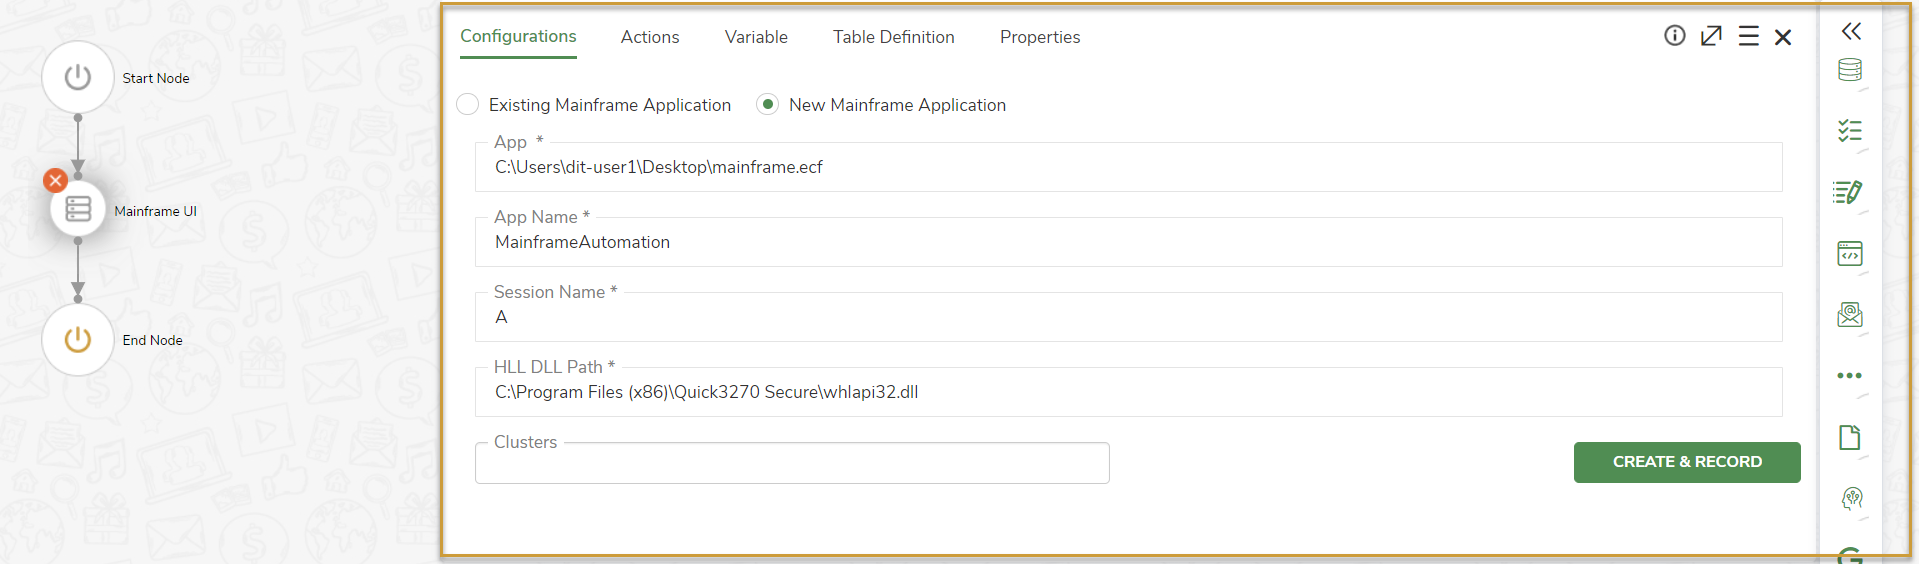
In Configurations tab, enter the following details:
- App: Path of Mainframe application. It can be either a configuration session file or an .exe file.
- .exe: You must establish a mainframe connection.
- Session file: The connection to system is already established in the session file. The emulator is ready to do the automation.
- App Name: Name for the application being configured so that it can be reused across similar process automation.
- Session Name: Type the session shortname, for example, for the first session, enter A.
- HLL DLL Path: Path of the DLL from the Mainframe application folder.
- Cluster: Select Cluster from the drop-down if you wish to run the node on Cluster. Otherwise, leave it blank.
HLLAPI Monitoring Protocol is used in JIFFY.ai to communicate with mainframe computer using applications like, terminal emulators.
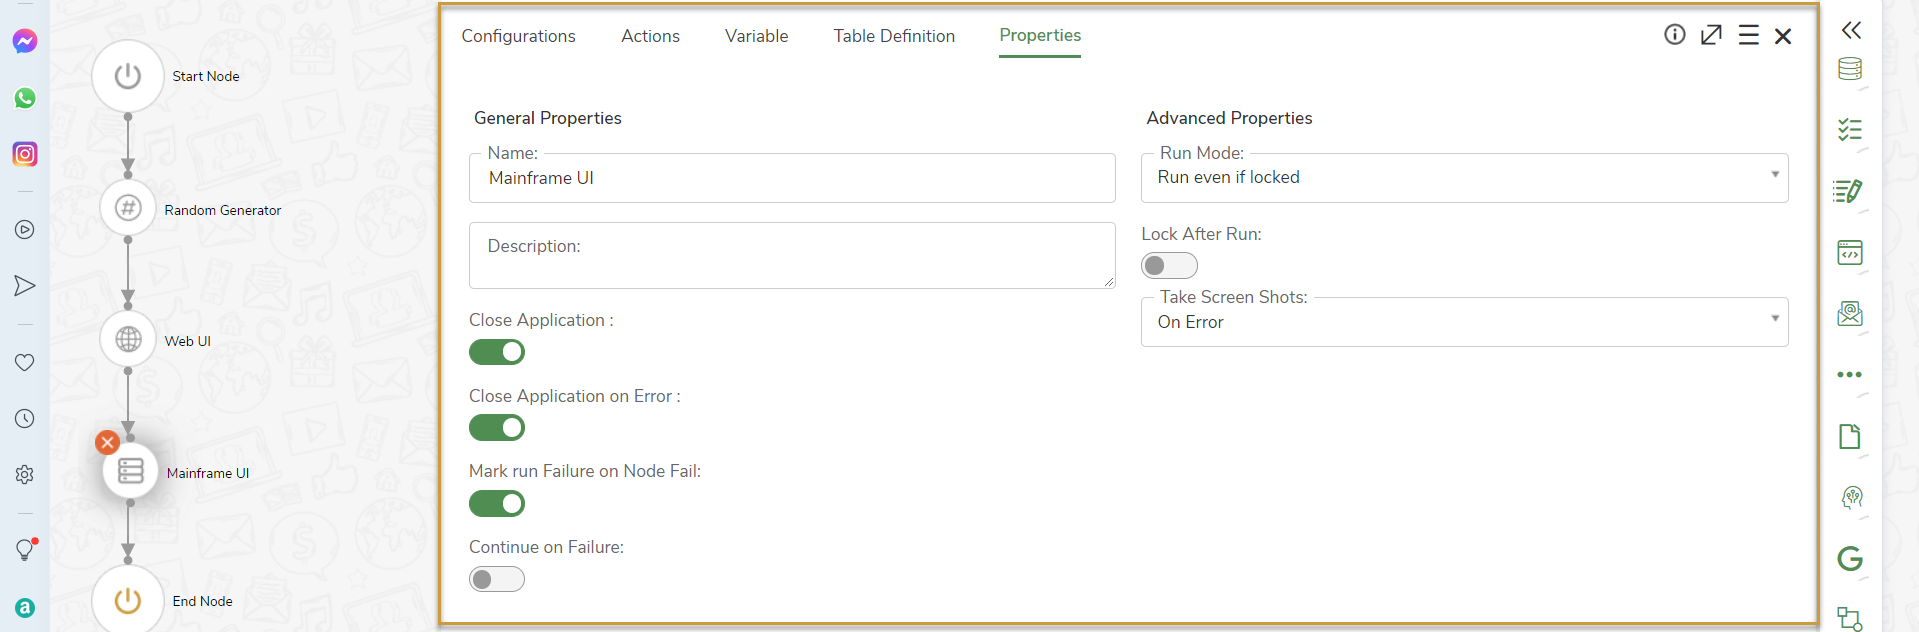
Properties of Mainframe UI Node
- Navigate to Properties tab and enter Name and Description.
- Select options for Run Mode and Take screenshot fields from the drop-down.
- Enable Close Application, Close Application on Error, Mark run Failure on Node Fail, Continue on Failure, and Lock After Run options as required.
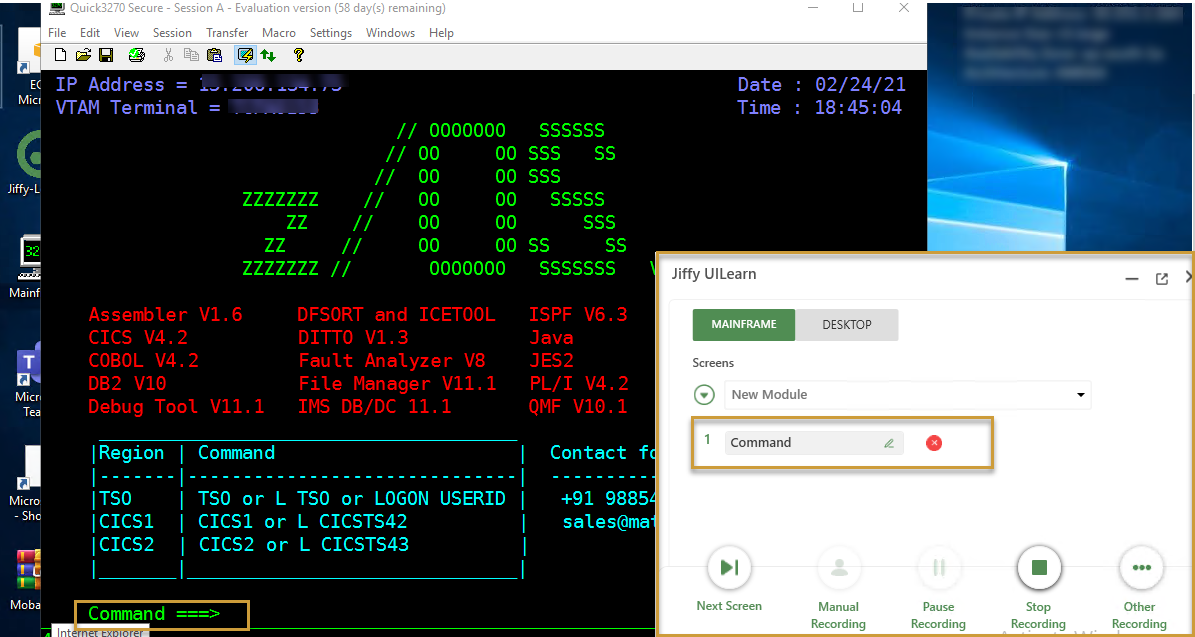
Record UI of Mainframe Application
To automate screen entry and retrieve values, familiarize screen coordinates by recording row and column numbers of the command line.
- Place the cursor on the starting point of the command line to be recorded and press Ctrl key. To know more about how to record UI elements, click here.
The row number and column number of the command line gets captured. The controls recorded are listed under the New Module screen. The names and actions of the controls can be edited as required.
- Click the Stop Recording button on the Jiffy UILearn floating window after recording is completed.
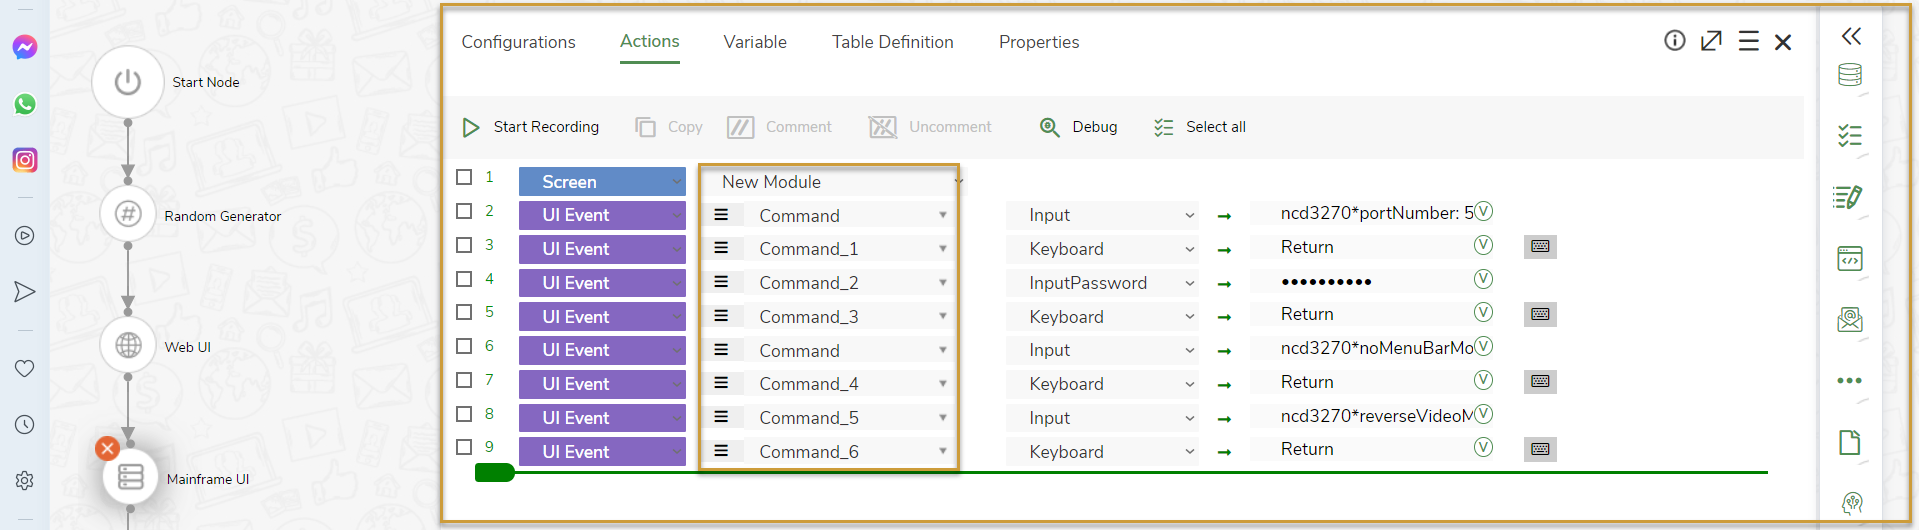
Design Actions in Mainframe UI Node
You can modify the UI actions in the Action tab of Mainframe UI node.
In the Actions tab, all the recorded screen coordinates are listed as commands where you can design and modify the actions.
Alternate Way
You can manually enter the screen coordinates in Actions Tab. No familiarization is required as it replicates Presentation Screen of the selected screen.
- Select Screen from the first drop-down and select the recorded screen from the second drop-down.
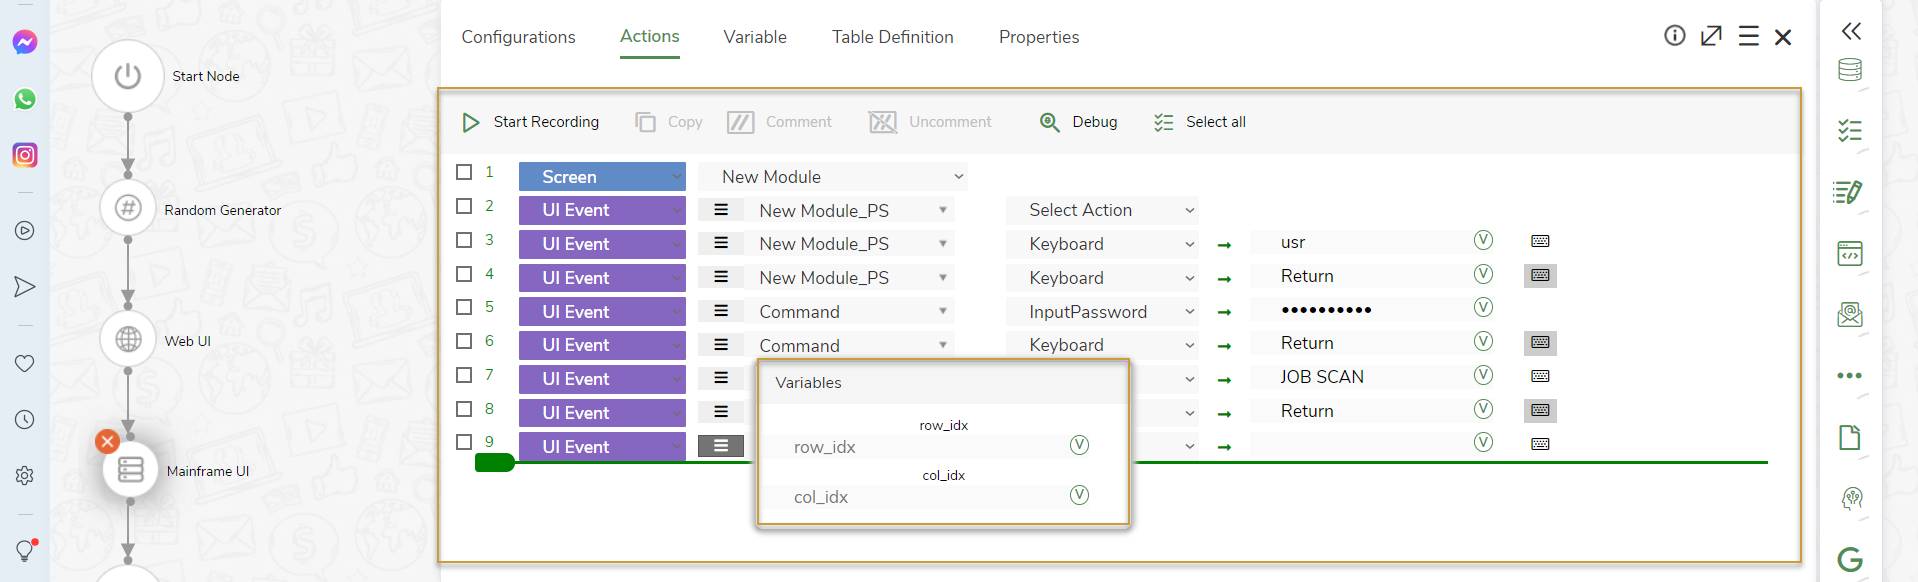
- Add a new UI Event and select value from the second drop-down. For a New Module screen, the options New Module_PS and New Module_Application and the recordedd commands are listed in the second drop-down.
- Select the option New Module_PS from the second drop-down to manually enter the row number and column number of the command line.
- Click the
.png) icon.
icon.
- Enter the row number in row_idx field and column number in col_idx field.
- Select Keyboard action from the third drop-down to enter the command.
- Select the option New Module_Application from the second drop-down and select BringToFront or Keyboard action from the third drop-down as required.
To know more about how to design actions, click here.
Select Input action to enter the command JOB SCAN and select Keyboard action and press enter to return the value entered.
Variables
All Input/Local variables created for the node are displayed under the Variables tab.
Table Definitions
All Default and Custom DataTables created in the Task are displayed under the Table Definitions tab.
Result of Execution in Mainframe UI Node
After executing task, Result of Execution window is displayed with the following tabs.
- Input: The input variables mapped to the Mainframe UI node are displayed.
- Output: Execution status and the values of the output variables in the current node that can be mapped to the succeeding nodes are displayed.
- Run Info: The Run Details, Configuration Details, and Machine Details are displayed.
- Run Details include Run ID, Sequence Number, Iteration ID, and Total Node Execution Time (in seconds).
- Configuration Details include Configuration Name, App, Application Path, Clusters, and Config Level.
- Machine Details include ID, Name, Host, Port, Iteration Start Time, Iteration End Time, and Iteration Time (in seconds).
- Step Data: The details and status of the each Line of Action inside the node are displayed.
- Formatted Output: The table data of the output variable with Type selected as Table is displayed.

.png)