Component Properties
Last Updated: May 10, 2022
Last Updated: May 10, 2022
Click the ![]() icon to change the Component Properties.
icon to change the Component Properties.
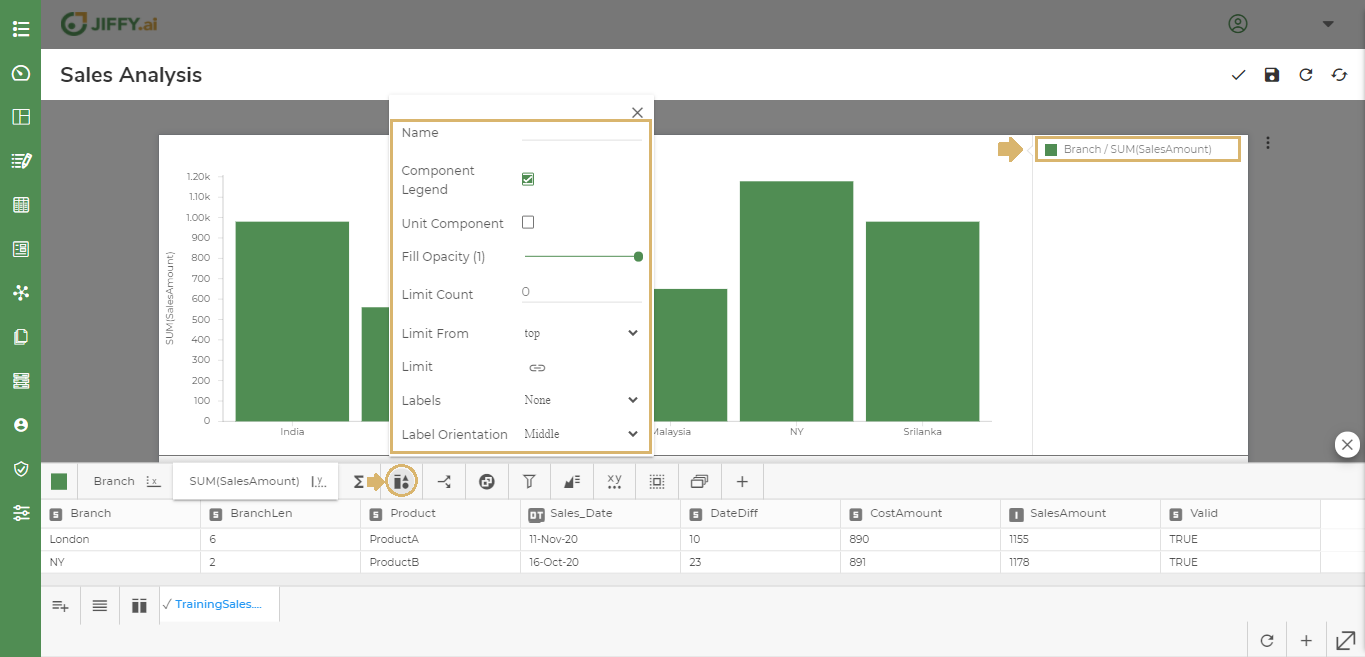
The component properties displayed depends on the Chart type.
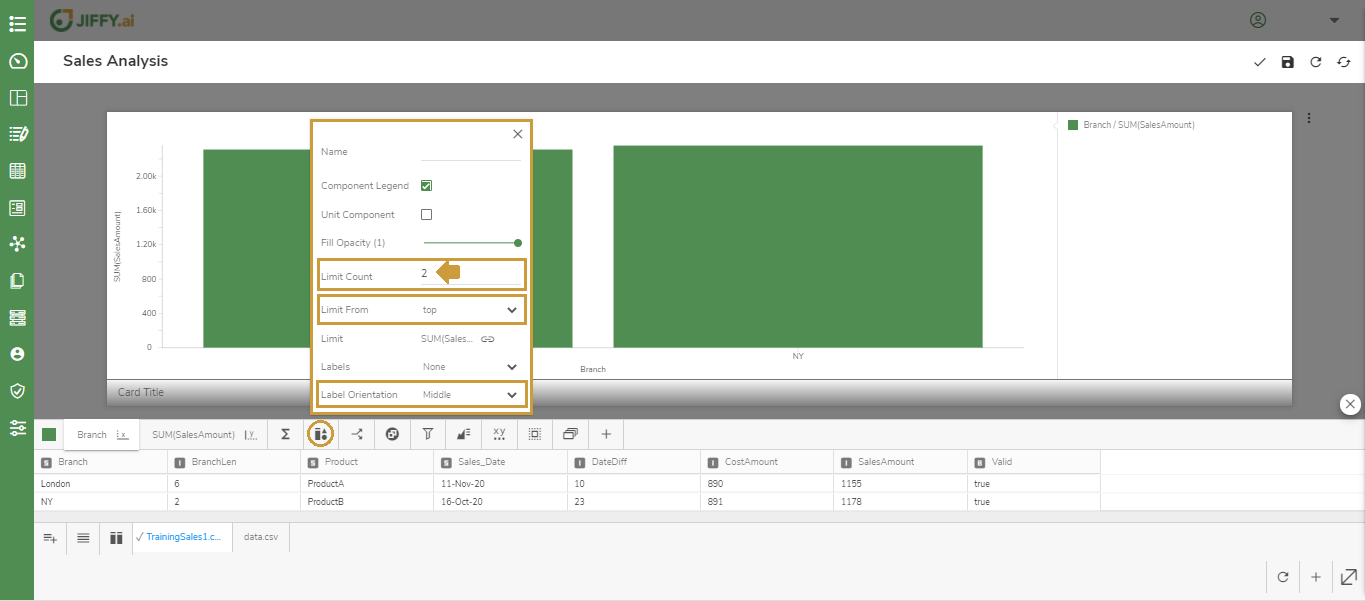
Component Legend to display the legend keys for multiple components used in the Chart.
There can be large quantities of categorical values in the Chart when plotting data. Use this option to limit the top or bottom values.
Click the ![]() icon in the Limit attribute.
icon in the Limit attribute.
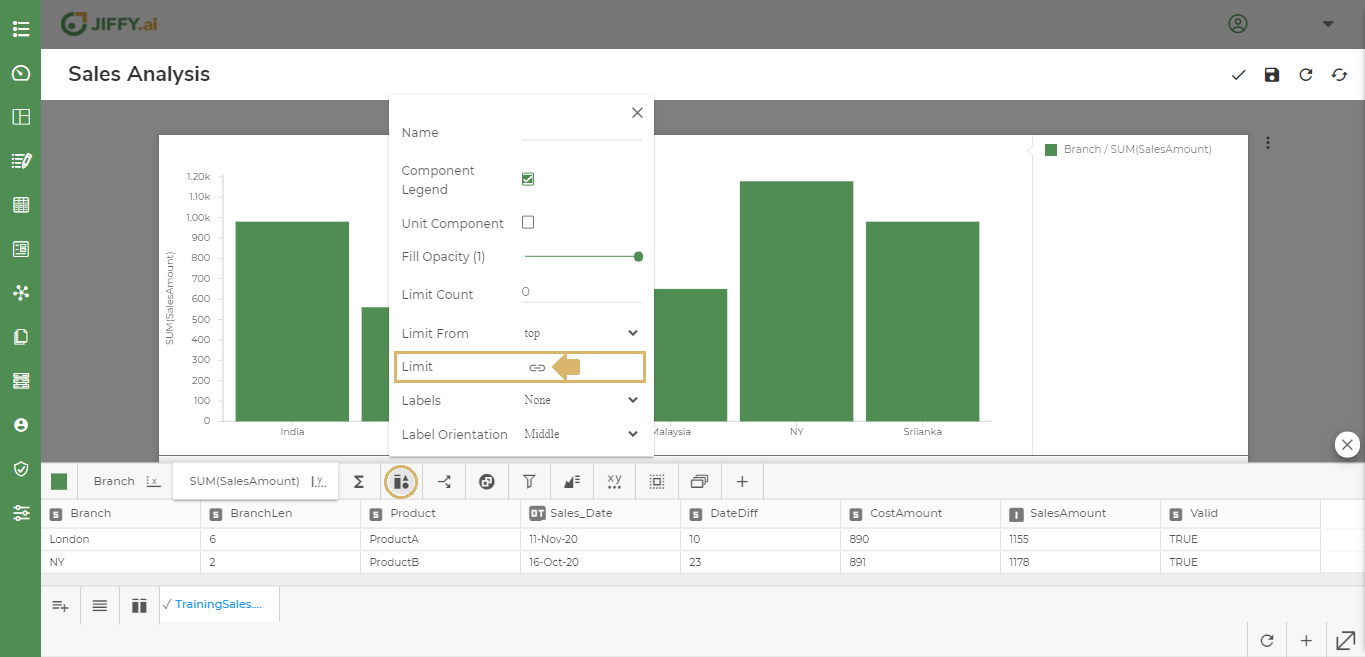
Select the column to set the limit. For example, SalesAmount - by default SUM function is selected. Change the function as desired.
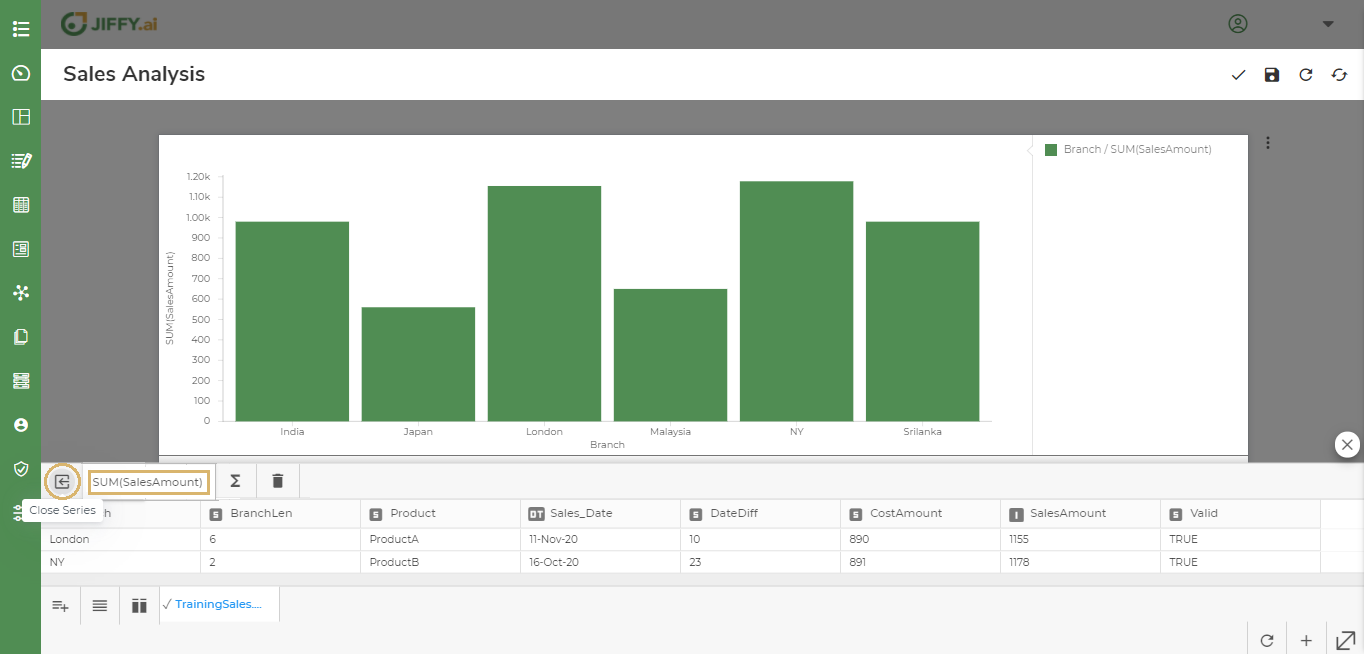
Set the Limit Count as 2 and Limit From as Top to display the top 2 Branches with highest sales.
 Change the Limit From to Bottom to display the 2 Branches with lowest sales. For example, Japan and Malaysia Branches will be displayed as they have the lowest sales.
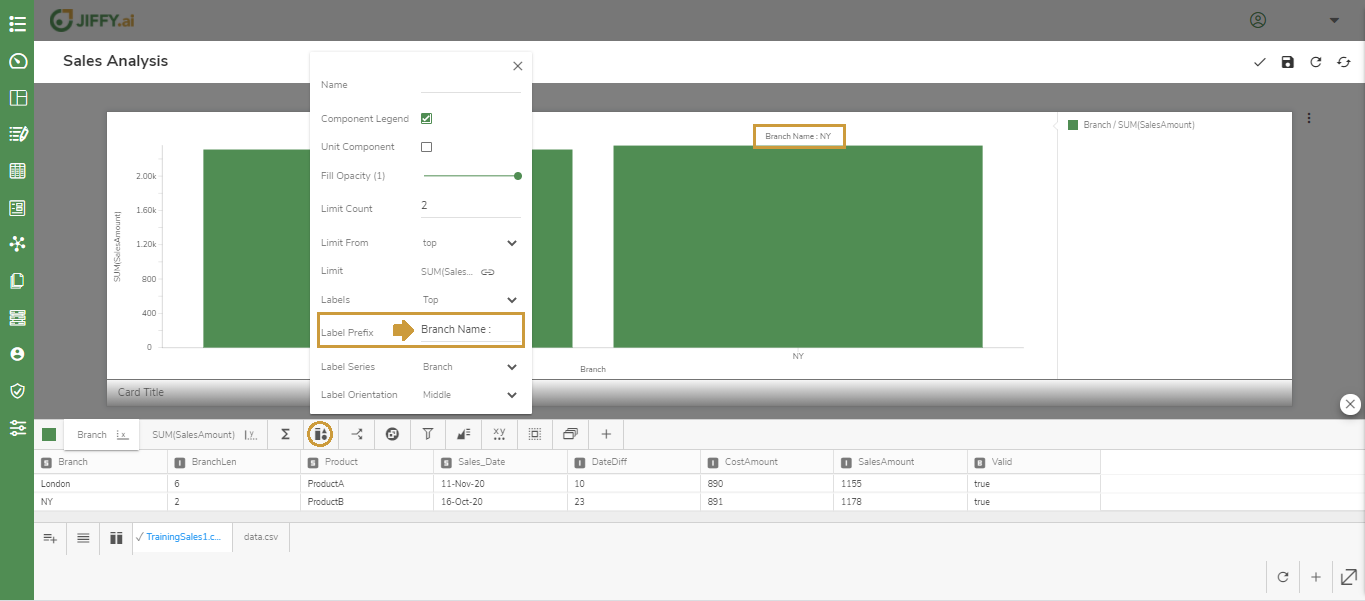
Use this option, to choose the position and orientation of labels in the Chart.
Set the Labels to display on Top or Bottom.
Set the Label Series to display the x-axis or y-axis names.
Set the Label Orientation either to Middle, Left, or Right.
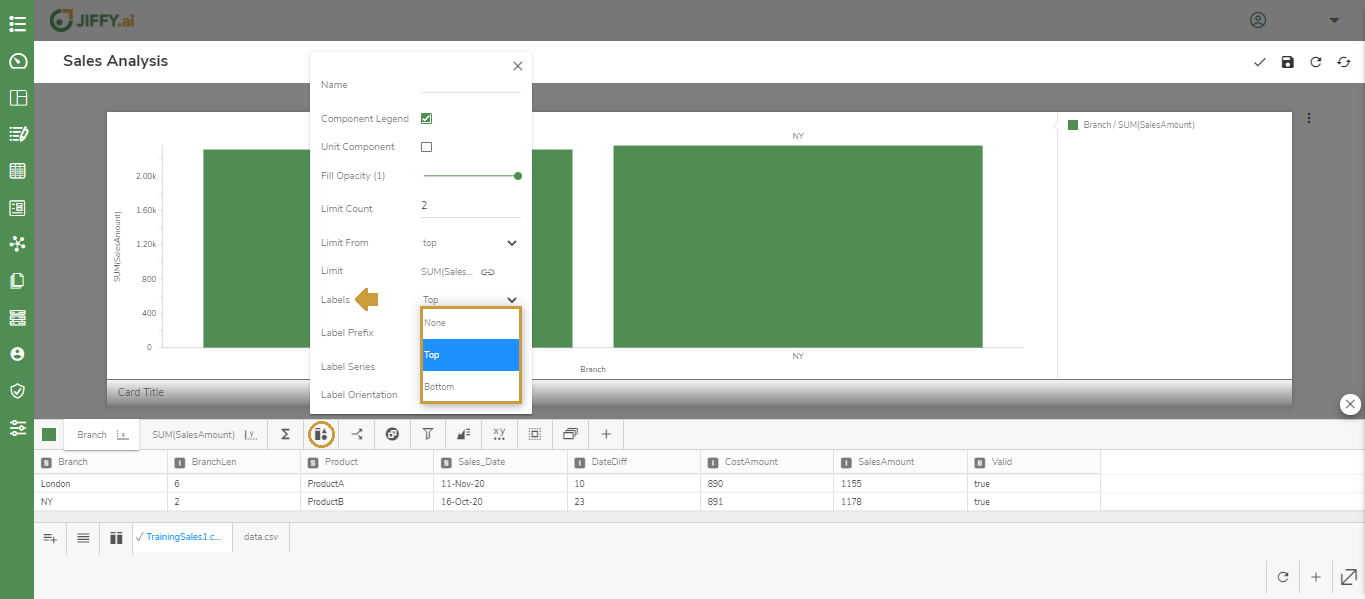
Set the Label Prefix to add a prefix before the selected label series. For example, Branch Name.